
Lewis Electron Dot Diagrams
Learning Objectives:
Draw a Lewis electron dot diagram for an atom or a monatomic ion.
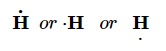
A Lewis electron dot diagram (or electron dot diagram, or a Lewis diagram, or a Lewis structure) is a representation of the valence electrons of an atom that uses dots around the symbol of the element. The number of dots equals the number of valence electrons in the atom. These dots are arranged to the right and left and above and below the symbol, with no more than two dots on a side. (The order in which the positions are used does not matter.) For example, the Lewis electron dot diagram for hydrogen is simply H⋅
Because the side is not important, the Lewis electron dot diagram could also be drawn as follows:
The electron dot diagram for helium, with two valence electrons, is as follows: He:.
By putting the two electrons together on the same side, we emphasize the fact that these two electrons are both in the 1s subshell; this is the common convention we will adopt, although there will be exceptions later. The next atom, lithium, has an electron configuration of 1s22s1, so it has only one electron in its valence shell. Its electron dot diagram resembles that of hydrogen, except the symbol for lithium is used: Li⋅
Beryllium has two valence electrons in its 2s shell, so its electron dot diagram is like that of helium: Be:
The next atom is boron. Its valence electron shell is 2s22p1, so it has three valence electrons. The third electron will go on another side of the symbol:

Again, it does not matter on which sides of the symbol the electron dots are positioned.
For carbon, there are four valence electrons, two in the 2s subshell and two in the 2p subshell. As usual, we will draw two dots together on one side, to represent the 2s electrons. However, conventionally, we draw the dots for the two p electrons on different sides. As such, the electron dot diagram for carbon is as follows:

With N, which has three p electrons, we put a single dot on each of the three remaining sides:

For oxygen, which has four p electrons, we now have to start doubling up on the dots on one other side of the symbol. When doubling up electrons, make sure that a side has no more than two electrons.

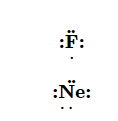
Fluorine and neon have seven and eight dots, respectively:
With the next element, sodium, the process starts over with a single electron because sodium has a single electron in its highest-numbered shell, the n = 3 shell. By going through the periodic table, we see that the Lewis electron dot diagrams of atoms will never have more than eight dots around the atomic symbol.
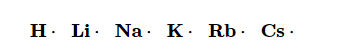
Elements in the same column of the periodic table have similar Lewis electron dot diagrams because they have the same valence shell electron configuration. The electron dot diagrams for the first column of elements are as follows:
Monatomic ions are atoms that have either lost (for cations) or gained (for anions) electrons. Electron dot diagrams for ions are the same as for atoms, except that some electrons have been removed for cations, while some electrons have been added for anions. Thus, in comparing the electron configurations and electron dot diagrams for the Na atom and the Na+ ion, we note that the Na atom has a single valence electron in its Lewis diagram, while the Na+ ion has lost that one valence electron:
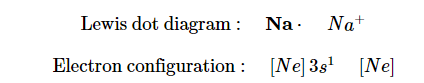
Technically, the valence shell of the Na+ ion is now the n = 2 shell, which has eight electrons in it. So why do we not put eight dots around Na+? Conventionally, when we show electron dot diagrams for ions, we show the original valence shell of the atom, which in this case is the n = 3 shell and empty in the Na+ ion.
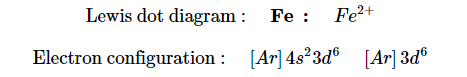
In making cations, electrons are first lost from the highest numbered shell, not necessarily the last subshell filled. For example, in going from the neutral Fe atom to the Fe2+ ion, the Fe atom loses its two 4s electrons first, not its 3d electrons, despite the fact that the 3d subshell is the last subshell being filled. Thus, we have
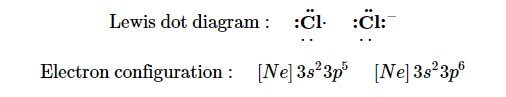
Anions have extra electrons when compared to the original atom. Here is a comparison of the Cl atom with the Cl− ion:
Summary
Lewis electron dot diagrams use dots to represent valence electrons around an atomic symbol.
Lewis electron dot diagrams for ions have less (for cations) or more (for anions) dots than the corresponding atom.

