
Sensitivity Analysis
Sensitivity analysis is sometimes called “what-if” analysis. It reveals how much the NPW will change in response to a given change of a critical factor.
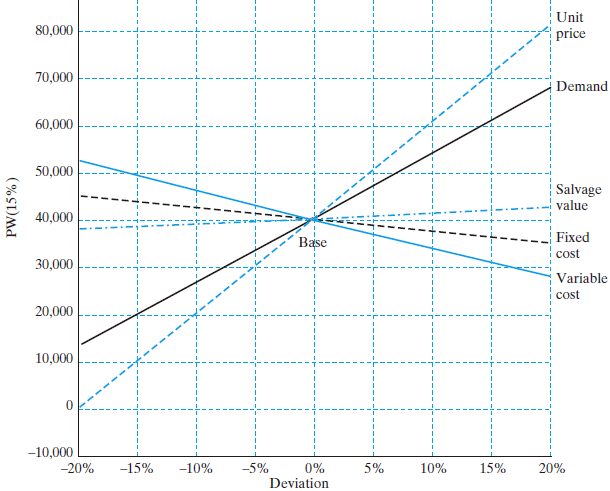
Spiderplot of Sensitivity
The slopes of the lines show how sensitive the NPW is to change for each factor.
The steeper the slope, the more sensitive the NPW is to a change in a particular factor.
Spiderplot identifies the crucial factors that affect the final outcome most.
Plot Sensitivity Graphs
Single alternative
Multiple MEA: based on incremental analysis
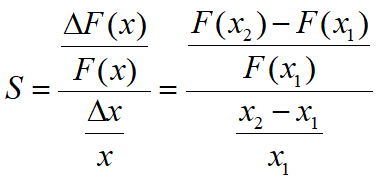
Degree of Sensitivity
Scenario Analysis
To look for the combined impacts of objective changes in two or more sensitive factors.
Optimistic-Most Likely-Pessimistic (O-ML-P) technique
Optimistic value: the most favorable estimate
Most likely value: the base estimate
Pessimistic value :the most unfavorable estimate
