
潮位监测
利用PBO研究地球水循环
安装浮标
GPS海平面变化
以下节选自 Kristine M Larson
(https://www.kristinelarson.net/portfolio/measuring-water-levels-with-gps/)
GPS signals will reflect off water surfaces. Unlike soil moisture and snow depth, which varies most dynamically only on the day that it rains or snows, water levels can vary quite a bit during the day. This adds a bit of complexity for using the GPS Interferometric Reflectometry (GPS-IR) technique to measure tidal variations. On the plus side, if you are using GPS-IR, then you are simultaneously measuring the location of the GPS antenna in the International Terrestrial Reference Frame, which allows you to correct for any ground motion or monument instability.
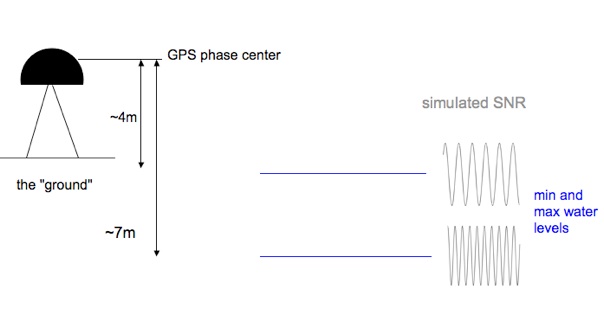
The effect of varying water levels is shown in this cartoon – reflections from 4 meters below the antenna are lower frequency than reflections from 7 meters.
GPS-IR was first demonstrated at GPS sites at Onsala (Sweden), Friday Harbor (Washington), and Peterson Bay (Alaska). Shown below are some results from the Peterson Bay effort. More details are available from the 2013 IEEE GRSL paper.
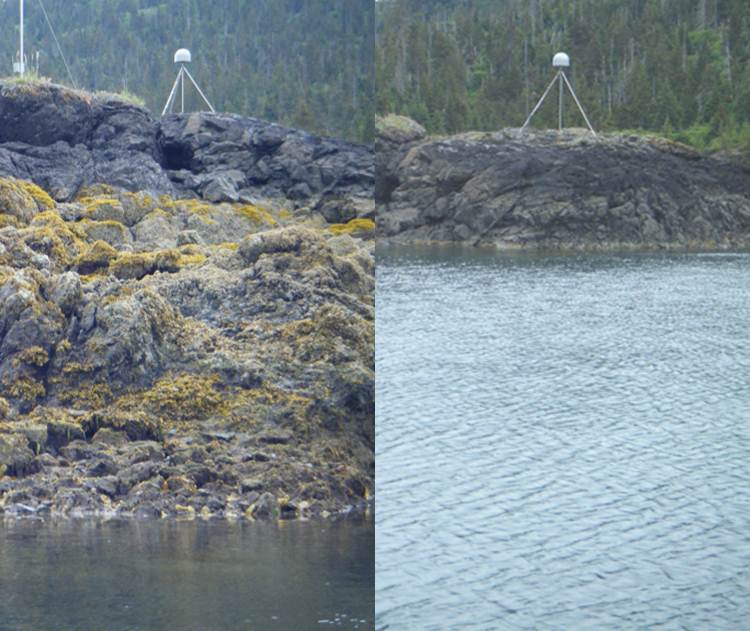
Photos of the Peterson Bay GPS site at low and high tide. Photo credit: Clara Chew.
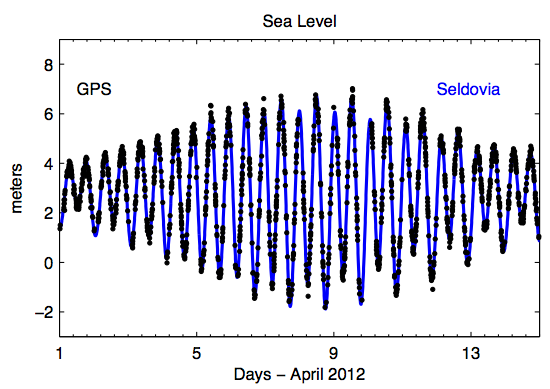
Water levels measured by NOAA (at Seldovia) and GPS (Peterson Bay).
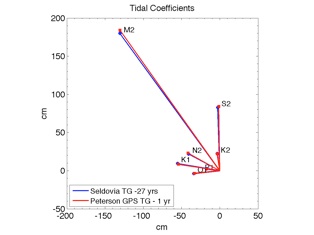
Tidal coefficients show good agreement between the “real” tide gauge and GPS.
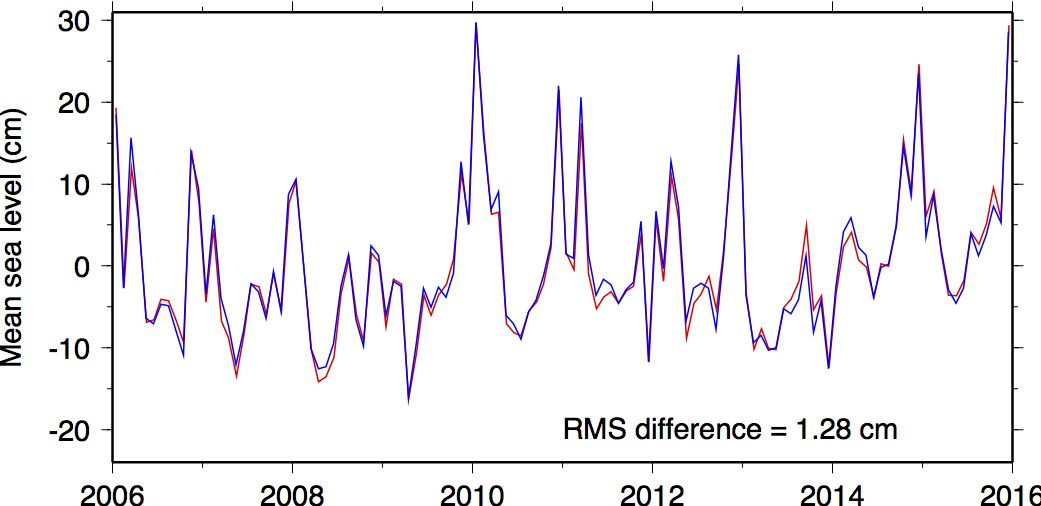
Comparison of monthly averages for GPS (blue) and NOAA (red).
Most recently I have been working with Richard Ray (Goddard Space Flight Center) and Simon Williams (National Oceanography Centre) to analyze a 10-year time series from Friday Harbor, Washington. Although the newer L2C signals are not available over this time period, the less precise L1 data are. As shown here, the GPS water level estimates are very consistent with the tide gauge. The Friday Harbor GPS site -SC02 – is operated by UNAVCO for the EarthScope Plate Boundary Observatory. NOAA operates the tide gauge. See my publications page for the refereed publication.

