What Does The Coffee Supply Chain Look Like?
View a more detailed version of the above graphic by clicking here
There’s a good chance your day started with a cappuccino, or a cold brew, and you aren’t alone. In fact, coffee is one of the most consumed drinks on the planet, and it’s also one of the most traded commodities.
According to the National Coffee Association, more than 150 million people drink coffee on a daily basis in the U.S. alone. Globally, consumption is estimated at over 2.25 billion cups per day.
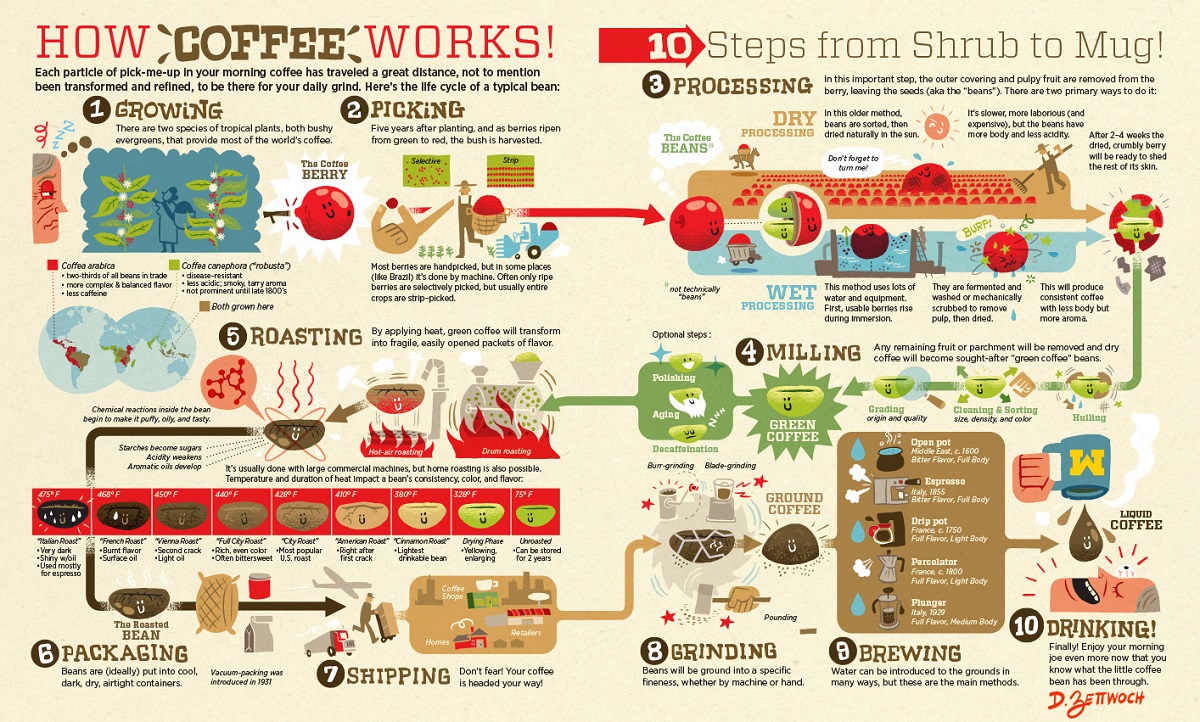
But before it gets to your morning cup, coffee beans travel through a complex global supply chain. Today’s illustration from Dan Zettwoch breaks down this journey into 10 distinct steps.
从咖啡豆到咖啡:咖啡供应链
咖啡供应链是什么样的?
查看上图的更详细版本点击这里
您的一天很有可能从卡布奇诺或冷酿开始,而且您并不孤单。事实上,咖啡是地球上消费量最大的饮料之一,也是交易量最大的商品之一。
根据美国国家咖啡协会的数据,仅在美国,每天就有超过 150.2 亿人喝咖啡。在全球范围内,每天的消费量估计超过25.<>亿杯。
但在它到达你的早晨杯子之前,咖啡豆会穿过一个复杂的全球供应链。今天的插图来自丹·泽特沃奇将这段旅程分为 10 个不同的步骤。
Coffee From Plant to Factory
There are two types of tropical plants that produce coffee, both preferring high altitudes and with production primarily based in South America, Asia, and Africa.
Coffea arabica is the more plentiful bean, with a more complex flavor and less caffeine. It’s used in most specialty and “high quality” drinks as Arabica coffee.
Coffea canephora, meanwhile, has stronger and more bitter flavors. It’s also easier to grow, and is most frequently used in espressos and instant blends as Robusta coffee.
However, both types of beans undergo the same journey:
Growing
Plants take anywhere from 4-7 years to produce their first harvest, and grow fruit for around 25 years.Picking
The fruit of the coffea plant is the coffee berry, containing two beans within. Ripened berries are harvested either by hand or machine.Processing
Coffee berries are then processed either in a traditional “dry” method using the sun or “wet” method using water and machinery. This removes the outer fruit encasing the sought-after green beans.Milling
The green coffee beans are hulled, cleaned, sorted, and (optionally) graded.
•在咖啡到达你的早晨杯子之前,咖啡豆会穿过一个复杂的全球供应链,这段旅程分为 10 个不同的步骤:
•从种植园到工厂的咖啡•
有两种类型的热带植物生产咖啡,都喜欢高海拔地区,主要生产在南美洲、亚洲和非洲。
•阿拉比卡咖啡(Coffeaarabica)是更丰富的豆类,味道更复杂,咖啡因更少。它作为阿拉比卡咖啡用于大多数特色和“高品质”饮料中。
•与此同时,中果咖啡(coffeacanephora)具有更强烈和更苦的味道。它也更容易种植,最常用于浓缩咖啡和速溶混合物中,如罗布斯塔咖啡。•然而,这两种类型的豆子经历相同的旅程:
1.种植:植物需要 4-7年才能产生第一次收获,并种植果实大约25 年。
2.采摘:咖啡植物的果实是咖啡浆果,里面含有两颗豆子。成熟的浆果可以通过手工或机器收获。
3.加工:咖啡浆果然后使用太阳以传统的“干”方法或使用水和机械的“湿”方法进行加工。这是为了去除外层果皮,里面包裹着的就是广受欢迎的青豆。
4.碾磨:生咖啡豆被去壳、清洁、分类和(可选)分级。
From Factory to Transport
Once the coffee berry is stripped down to green beans, it’s shipped from producing countries through a global supply network.
Green coffee beans are exported and shipped around the world. In 2018 alone, 7.2 million tonnes of green coffee beans were exported, valued at $19.2 billion.
Arriving primarily in the U.S. and Europe, the beans are now prepared for consumption:
Roasting
Green beans are industrially roasted, becoming darker, oilier, and tasty. Different temperatures and heat duration impact the final color and flavor, with some preferring light roasts to dark roasts.Packaging
Any imperfect or somehow ruined beans are discarded, and the remaining roasted beans are packaged together by type.Shipping
Roasted beans are shipped both domestically and internationally. Bulk shipments go to retailers, coffee shops, and in some cases, direct to consumer.
•从工厂到运输
一旦咖啡浆果被剥离成生豆,它就会通过全球供应网络从生产国运出。生咖啡豆出口并运往世界各地。仅在2018年,就出口了7万吨生咖啡豆,价值2亿美元。这些豆子主要运往美国和欧洲,现在准备食用:
5.烤(烘焙):青豆经过工业烘烤,变得更黑、更油、更美味。不同的温度和热持续时间会影响最终的颜色和风味,有些人更喜欢浅烤而不是深烤。
6.包装:任何不完美或以某种方式被毁坏的豆子都会被丢弃,剩余的烤豆按类型包装在一起。
7.运输:烤豆在国内和国际上运输。散装货物流向零售商、咖啡店,在某些情况下,直接发往消费者。
Straight to Your Cup
Roasted coffee beans are almost ready for consumption, and by this stage the remaining steps can happen anywhere.
For example, many factories don’t ship roasted beans until they grind it themselves. Meanwhile, cafes will grind their own beans on-site before preparing drinks. The rapid growth of coffee chains made Starbucks the second-highest-earning U.S. fast food venue.
Regardless of where it happens, the final steps bring coffee straight to your cup:
Grinding
Roasted beans are ground up in order to better extract their flavors, either by machine or by hand. The preferred fineness depends on the darkness of the roast and the brewing method.Brewing
Water is added to the coffee grounds in a variety of methods. Some involve water being passed or pressured through the grounds (espresso, drip) while others mix the water and grounds (French press, Turkish coffee).Drinking
Liquid coffee is ready to be enjoyed! One average cup takes 70 roasted beans to make.
The world’s choice of caffeine pick-me-up is made possible by this structured and complex supply chain. Coffee isn’t just a drink, after all, it’s a business.
•直达您的杯子
烘焙咖啡豆几乎可以食用了,到这个阶段,剩下的步骤可以在任何地方发生。例如,许多工厂在自己研磨之前不会运送烤豆。同时,咖啡馆会在准备饮料之前在现场研磨自己的豆子。咖啡连锁店的快速增长使星巴克成为美国快餐收入第二的品牌.
•无论它发生在何处,最后的步骤都会将咖啡直接送到您的杯子上:
8.研磨:烤豆被磨碎,以便更好地通过机器或手工提取其风味。首选的细度取决于烤肉的暗度和酿造方法。
9.冲泡:水以多种方法添加到咖啡渣中。有些涉及水通过或加压通过咖啡渣(浓缩咖啡,滴水),而另一些则混合水和咖啡渣(法式压榨,土耳其咖啡)。
10.喝:液体咖啡已经准备好享受了!一个普通的杯子需要 70 个烤豆才能制作。
•世界上咖啡因提神剂的选择是由这个结构化和复杂的供应链实现的。毕竟,咖啡不仅仅是一种饮料,它是一种生意。
The Latte Index: Using the Impartial Bean to Value Currencies
The Impartial Bean
Using the price of a coffee to estimate currency value
The Chart of the Week is a weekly Visual Capitalist feature on Fridays.
Like any other market, there are many opinions on what a currency ought to be worth relative to others.
With certain currencies, that spectrum of opinions is fairly narrow. As an example, for the world’s most traded currency – the U.S. dollar – the majority of opinions currently fall in a range from the dollar being 2% to 11% overvalued, according to organizations such as the Council of Foreign Relations, the Bank of International Settlements, the OECD, and the IMF.
For other currencies, the spectrum is much wider. The Swiss franc, which some have called the world’s most perplexing currency, has estimates from those same groups ranging from about 13% undervalued to 21% overvalued.
Such a variance in estimates makes it hard to come up with any conclusive consensus – so in today’s chart, we refer to a more caffeinated and fun measure that also approximates the relative value of currencies.
The Impartial Bean
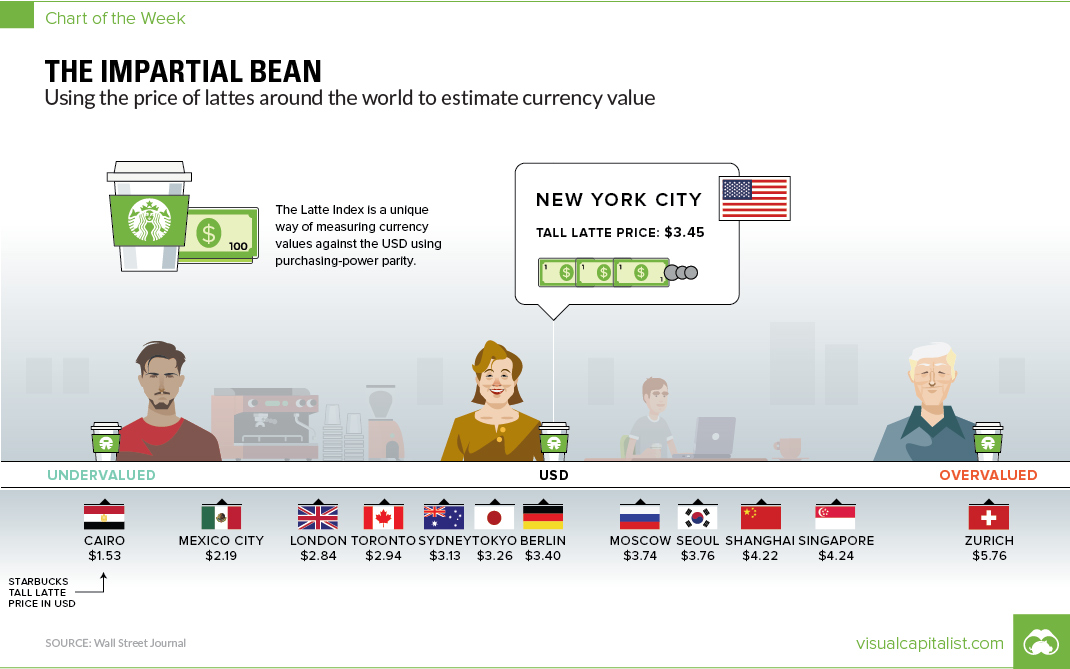
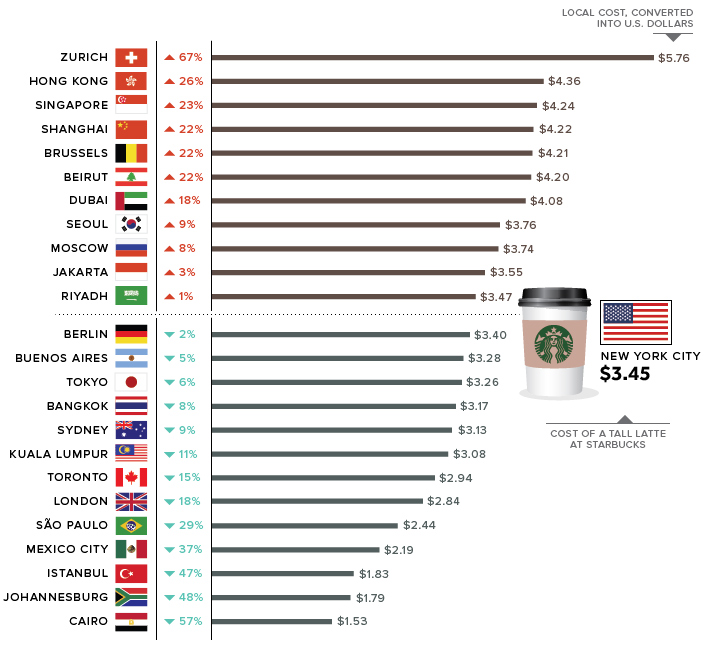
The “Latte Index”, developed by The Wall Street Journal, uses purchasing-power parity (PPP) – comparing the cost of the same good in different countries – to estimate which currencies are overvalued and undervalued.
In this case, the WSJ tracked down the price of a tall Starbucks latte in dozens of cities around the world. These prices are then converted to U.S. dollars and compared to the benchmark price, which is a tall Starbucks latte in New York City (US$3.45).
The Latte Index is mostly for fun, but it’s also broadly in line with predictions made by the experts.
For example, the price of a latte in Toronto, Canada works out to US$2.94, which is about 14.8% under the benchmark NYC price. This suggests that relative to the USD, the Canadian dollar is undervalued. Interestingly, estimates from the aforementioned sources (BIS, OECD, CFR, IMF) have the Canadian dollar at being up to 10% undervalued – which puts the Latte Index not too far off.
Given the wild range of estimates that exist for currency values, using the relative cost of a cup of joe might be as good of a proxy as any.
拿铁指数:使用公正的豆子对货币进行估值
公正的豆子
使用咖啡的价格来估计货币价值
这本周图表是每周五的视觉资本主义专题。
像任何其他市场一样,关于一种货币相对于其他货币的价值应该是多少,有很多意见。
对于某些货币,这种意见范围相当狭窄。例如,根据外交关系委员会、国际清算银行、经合组织和国际货币基金组织等组织的数据,对于世界上交易量最大的货币——美元——目前大多数观点的范围内被高估了2%至11%。
对于其他货币,范围要广得多。瑞士法郎,有人称其为世界上最令人困惑的货币,这些群体的估计范围从约13%被低估到21%被高估。
估计值的这种差异使得很难得出任何结论性的共识——所以在今天的图表中,我们指的是一种含咖啡因和更有趣的衡量标准,它也近似于货币的相对价值。
公正的豆子
“拿铁指数”,由《华尔街日报》,使用购买力平价(PPP)——比较不同国家同一商品的成本——来估计哪些货币被高估和低估。
在这种情况下,《华尔街日报》追踪了全球数十个城市一杯高星巴克拿铁的价格。然后将这些价格转换为美元,并与基准价格进行比较,基准价格是纽约市的高星巴克拿铁咖啡(3.45美元)。
拿铁指数主要是为了好玩,但它也与专家的预测大致一致。
例如,加拿大多伦多的拿铁价格为2.94美元,比纽约市基准价格低约14.8%。这表明相对于美元,加元被低估了。有趣的是,上述来源(BIS,OECD,CFR,国际货币基金组织)的估计显示,加元被低估了10%,这使得拿铁指数相差不远。
考虑到货币价值的估计范围很广,使用一杯乔的相对成本可能与任何代理一样好。
补充:
1.国际咖啡组织:《咖啡发展报告2021》
2.美国农业部(USDA)
Coffee World Markets and Trade 2022

