


How Gold Royalties Offer Inflation-Resistant Gold Exposure
How Gold Royalties Offer Inflation-Resistant Gold Exposure
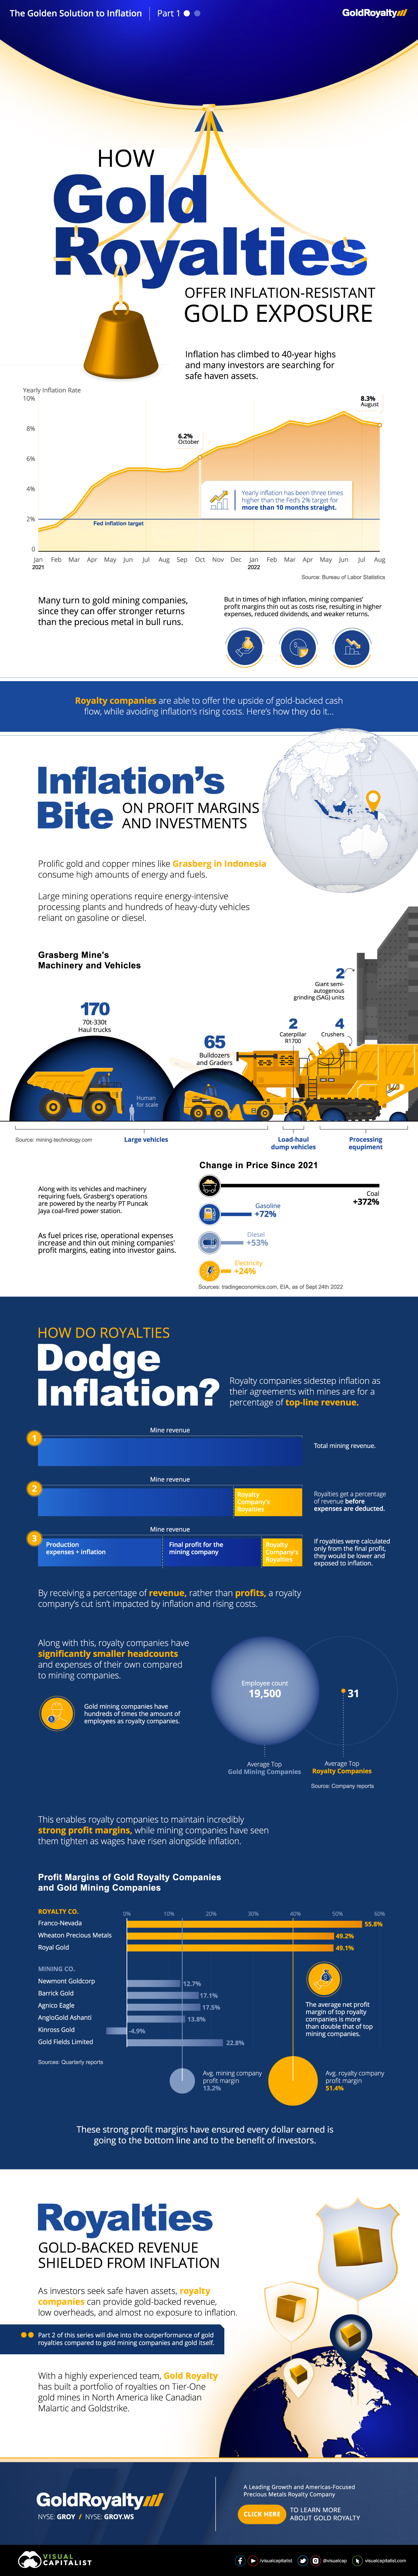
As rising inflation has increased the operational expenses of gold mining companies, gold royalty companies have emerged as an inflation-resistant alternative for investors seeking exposure to the precious metal.
Without exposure to rising wages, fuel, and energy costs, gold royalty companies are able to maintain strong profit margins that are often more than double those of gold mining companies.
This infographic sponsored by Gold Royalty is the first in a two-part series and showcases exactly how royalty companies naturally avoid inflation, along with the superior profit margins that come as a result.
Inflation’s Dampening Effect on Gold Mining Profits
Since mid-2021, inflation has become a constant risk-factor for investors to keep in mind as they manage their portfolio. Every energy fuel has risen in price over the last year alongside wage increases around the world, greatly impacting the expenses of material production and refining.
Gold mining is no exception, and while operational costs have risen, gold’s price has actually decreased slightly over the same time period, further impacting gold mines’ profitability and margins.
| Commodity | Price change since the start of 2021 |
|---|---|
| Coal | +372% |
| Gasoline | +72% |
| Diesel | +53% |
| Electricity | +24% |
| Gold | -13% |
The impact of inflation can’t be understated when it comes to mining operations, which require large amounts of machinery, electricity, and people.
Along with massive haul trucks, bulldozers, and machinery like large-scale grinding units that require diesel and other fuels to operate, refinery operations also consume large amounts of electricity.
How Gold Royalty Companies Avoid Inflation
With no large fleets of vehicles to fuel, refining plants to power, along with significantly smaller headcounts and wage bills, royalty companies barely suffer from rising inflation. Compared to gold mining companies with tens of thousands of employees across the world, gold royalty companies rarely employ more than 50 people.
Along with this, while royalty companies’ revenue comes from royalty and streaming agreements with mining companies, these agreements are structured to ensure royalty companies face none of the operational expenses (and inflation) that miners do.
This is because royalty agreements calculate royalties (which royalty companies receive) as a percentage of the mine’s top-line revenue rather than from the mine’s final profits after expenses, meaning royalty companies get their cut before operational costs and other expenses are deducted.
The Golden Profit Margins of Royalty Companies
With gold’s price having remained stagnant while inflation has pushed expenses up, gold mining company profit margins have been crunched from both sides while royalty companies have avoided the impact.
Over the last four quarters, gold mining giant Newmont Goldcorp’s average profit margin declined to 6.6% when compared to the 22.9% average margins of the four quarters prior. On the other hand, royalty company Franco-Nevada’s profit margins increased from 54.8% to 57.3% over the same time periods.
Without inflation impacting their bottom line, royalty companies have been able to maintain strong financials in a chaotic period for the economy.
In part 2 of this series, we’ll take a closer look at the returns of gold royalty companies, and how exactly they’ve outperformed both gold mining companies and the precious metal itself.
How Gold Royalties Offer Inflation-Resistant Gold Exposure
As rising inflation has increased the operational expenses of gold mining companies, gold royalty companies have emerged as an inflation-resistant alternative for investors seeking exposure to the precious metal.
Without exposure to rising wages, fuel, and energy costs, gold royalty companies are able to maintain strong profit margins that are often more than double those of gold mining companies.
This infographic sponsored by Gold Royalty is the first in a two-part series and showcases exactly how royalty companies naturally avoid inflation, along with the superior profit margins that come as a result.
Inflation’s Dampening Effect on Gold Mining Profits
Since mid-2021, inflation has become a constant risk-factor for investors to keep in mind as they manage their portfolio. Every energy fuel has risen in price over the last year alongside wage increases around the world, greatly impacting the expenses of material production and refining.
Gold mining is no exception, and while operational costs have risen, gold’s price has actually decreased slightly over the same time period, further impacting gold mines’ profitability and margins.
| Commodity | Price change since the start of 2021 |
|---|---|
| Coal | +372% |
| Gasoline | +72% |
| Diesel | +53% |
| Electricity | +24% |
| Gold | -13% |
The impact of inflation can’t be understated when it comes to mining operations, which require large amounts of machinery, electricity, and people.
Along with massive haul trucks, bulldozers, and machinery like large-scale grinding units that require diesel and other fuels to operate, refinery operations also consume large amounts of electricity.
How Gold Royalty Companies Avoid Inflation
With no large fleets of vehicles to fuel, refining plants to power, along with significantly smaller headcounts and wage bills, royalty companies barely suffer from rising inflation. Compared to gold mining companies with tens of thousands of employees across the world, gold royalty companies rarely employ more than 50 people.
Along with this, while royalty companies’ revenue comes from royalty and streaming agreements with mining companies, these agreements are structured to ensure royalty companies face none of the operational expenses (and inflation) that miners do.
This is because royalty agreements calculate royalties (which royalty companies receive) as a percentage of the mine’s top-line revenue rather than from the mine’s final profits after expenses, meaning royalty companies get their cut before operational costs and other expenses are deducted.
The Golden Profit Margins of Royalty Companies
With gold’s price having remained stagnant while inflation has pushed expenses up, gold mining company profit margins have been crunched from both sides while royalty companies have avoided the impact.
Over the last four quarters, gold mining giant Newmont Goldcorp’s average profit margin declined to 6.6% when compared to the 22.9% average margins of the four quarters prior. On the other hand, royalty company Franco-Nevada’s profit margins increased from 54.8% to 57.3% over the same time periods.
Without inflation impacting their bottom line, royalty companies have been able to maintain strong financials in a chaotic period for the economy.
In part 2 of this series, we’ll take a closer look at the returns of gold royalty companies, and how exactly they’ve outperformed both gold mining companies and the precious metal itself.
黄金特许权使用费如何提供抗通胀的黄金敞口
黄金特许权使用费如何提供抗通胀的黄金敞口
随着通胀上升增加了金矿公司的运营费用,黄金特许权使用费公司已成为寻求接触贵金属的投资者的抗通胀替代品。
在不受工资、燃料和能源成本上涨影响的情况下,黄金特许权使用费公司能够保持强劲的利润率,通常是金矿公司的两倍以上。
这张由 Gold Royalty赞助的信息图 是两部分系列中的第一张,展示了特许权使用费公司如何自然地避免通货膨胀,以及由此带来的超高利润率。
通货膨胀对黄金开采利润的抑制作用
自 2021 年年中以来, 通货膨胀 已成为投资者在管理其投资组合时要牢记的一个持续风险因素。去年,随着世界各地工资的上涨,每种能源燃料的价格都在上涨,极大地影响了材料生产和精炼的费用。
黄金开采也不例外,虽然运营成本上升,但同期黄金价格实际上略有下降,进一步影响了 金矿的盈利能力和利润率。
| 商品 | 自 2021 年初以来的价格变化 |
|---|---|
| 煤炭 | +372% |
| 汽油 | +72% |
| 柴油机 | +53% |
| 电 | +24% |
| 金子 | -13% |
对于需要大量机械、电力和人力的采矿作业,通货膨胀的影响不可低估。
除了需要柴油和其他 燃料 运行的大型运输卡车、推土机和大型研磨装置等机械外,炼油厂的运营也消耗大量电力。
黄金特许权使用费公司如何避免通货膨胀
由于没有大量车辆提供燃料,没有炼油厂提供电力,再加上员工人数和工资支出明显减少,特许权使用费公司几乎没有受到通货膨胀上升的 影响。与全球拥有数万名员工的金矿公司相比,黄金特许权使用费公司的员工人数很少超过 50 人。
与此同时,虽然特许权使用费公司的收入来自与矿业公司的特许权使用费和流媒体协议,但这些协议的结构是为了确保特许权使用费公司不会像矿工那样面临运营费用(和通货膨胀)。
这是因为特许权使用费协议将特许权使用费(特许权使用费公司收到的)计算为矿山收入的百分比, 而 不是从矿山扣除费用后的最终利润中计算的,这意味着特许权使用费公司 在 扣除运营成本和其他费用之前获得分成。
版税公司的黄金利润率
由于金价一直停滞不前,而通货膨胀推高了开支,金矿公司的利润率受到了双方的挤压,而特许权使用费公司却避免了这种影响。
在过去四个季度中,金矿巨头 Newmont Goldcorp 的平均利润率 下降 至 6.6%,而前四个季度的平均利润率为 22.9%。另一方面, 同期特许权使用费公司 Franco-Nevada 的利润率从 54.8% 增加到57.3%。
在没有通货膨胀影响其底线的情况下,特许权使用费公司能够在经济混乱时期保持强劲的财务状况。
在本系列的第 2 部分中,我们将仔细研究黄金特许权使用费公司的回报,以及它们究竟如何优于金矿公司和贵金属本身。

