
Charted: 40 Years of Global Energy Production, by Country
Energy was already a hot topic before 2022, but soaring household energy bills and a cost of living crisis has brought it even more to the forefront.
Which countries are the biggest energy producers, and what types of energy are they churning out? This graphic by 911 Metallurgist gives a breakdown of global energy production, showing which countries have used the most fossil fuels, nuclear, and renewable energy since 1980.
All figures refer to the British thermal unit (BTU), equivalent to the heat required to heat one pound of water by one degree Fahrenheit.
Editor’s note: Click on any graphic to see a full-width version that is higher resolution
1. Fossil Fuels
View the full-size infographic
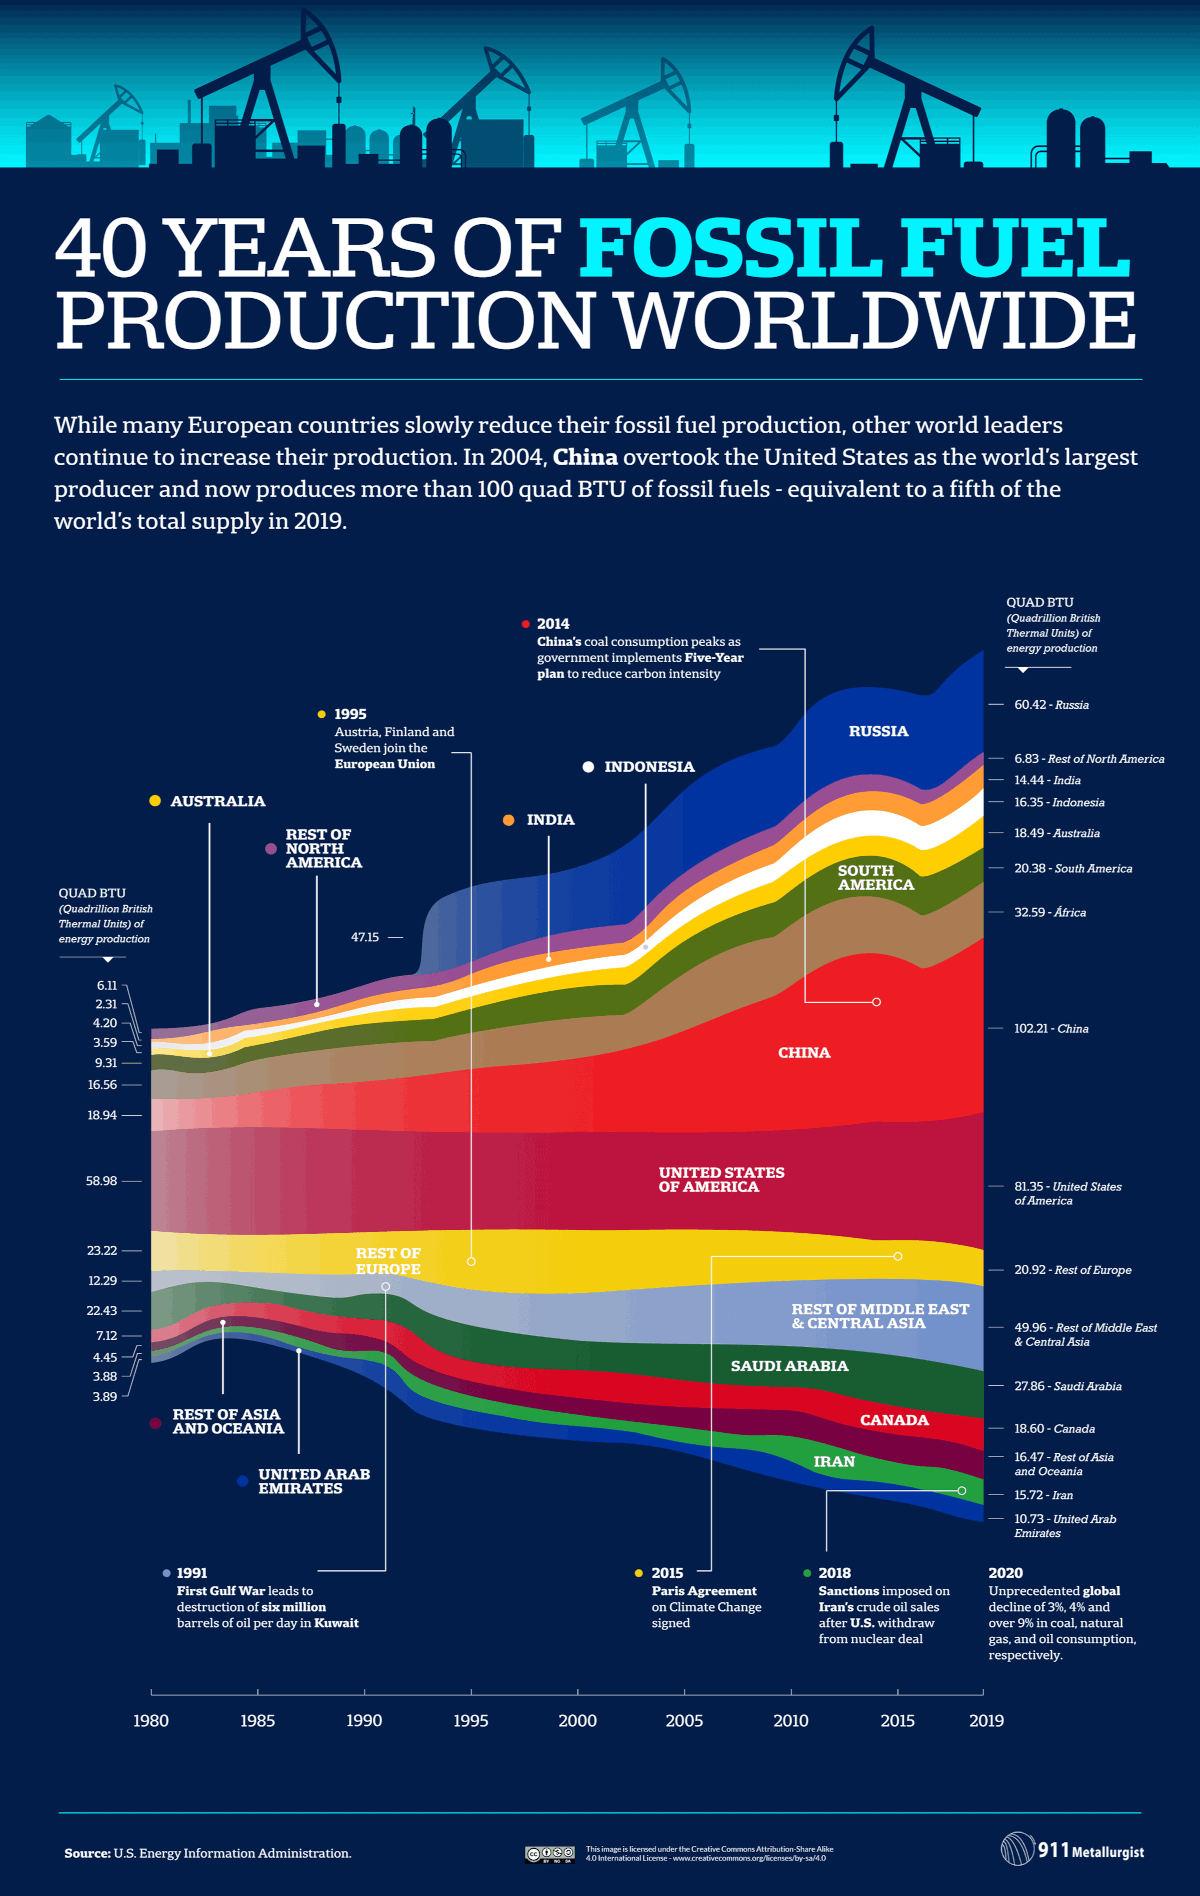
While the U.S. is a dominant player in both oil and natural gas production, China holds the top spot as the world’s largest fossil fuel producer, largely because of its significant production and consumption of coal.
Over the last decade, China has used more coal than the rest of the world, combined.
However, it’s worth noting that the country’s fossil fuel consumption and production have dipped in recent years, ever since the government launched a five-year plan back in 2014 to help reduce carbon emissions.
2. Nuclear Power
View the full-size infographic
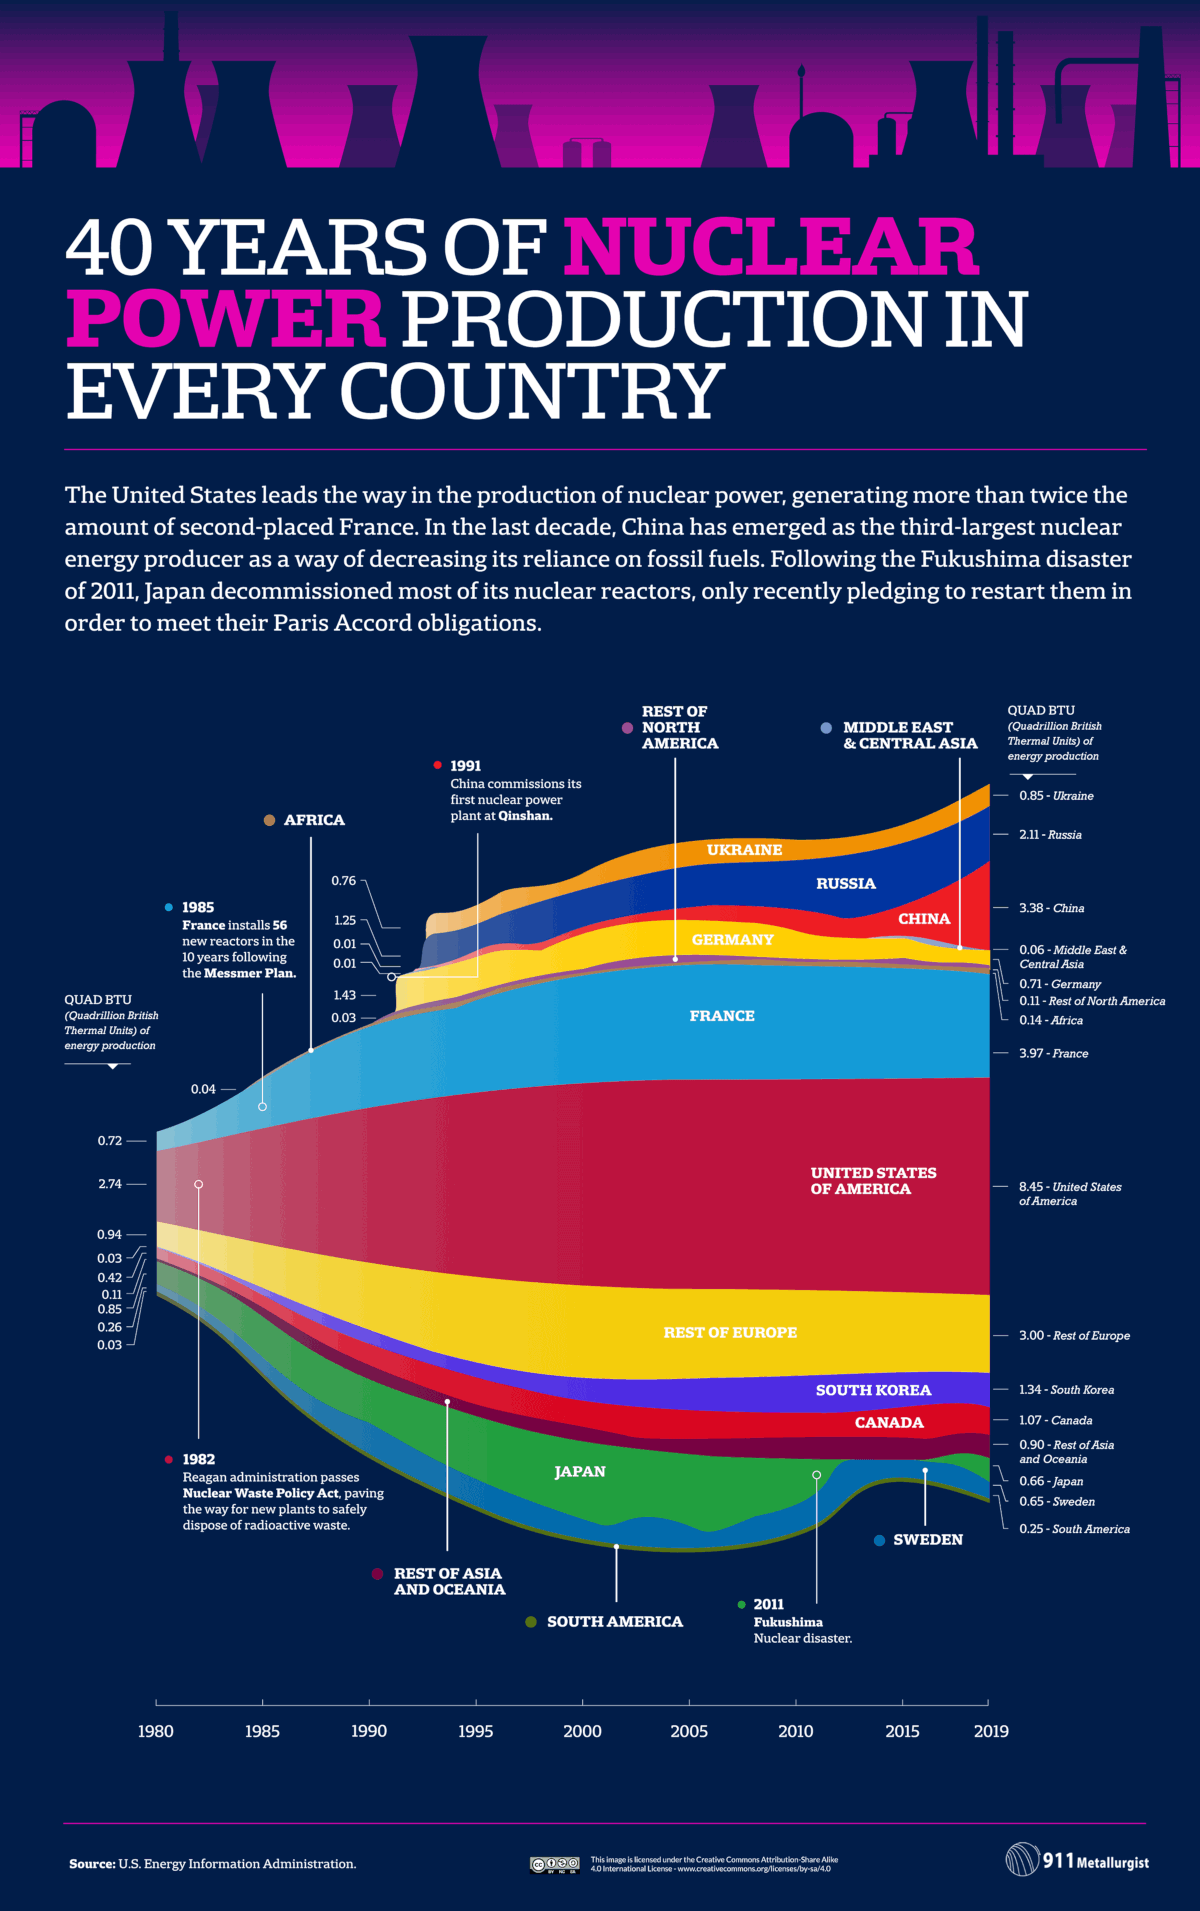
The U.S. is the world’s largest producer of nuclear power by far, generating about double the amount of nuclear energy as France, the second-largest producer.
While nuclear power provides a carbon-free alternative to fossil fuels, the nuclear disaster in Fukushima caused many countries to move away from the energy source, which is why global use has dipped in recent years.
Despite the fact that many countries have recently pivoted away from nuclear energy, it still powers about 10% of the world’s electricity. It’s also possible that nuclear energy will play an expanded role in the energy mix going forward, since decarbonization has emerged as a top priority for nations around the world.
3. Renewable Energy
View the full-size infographic
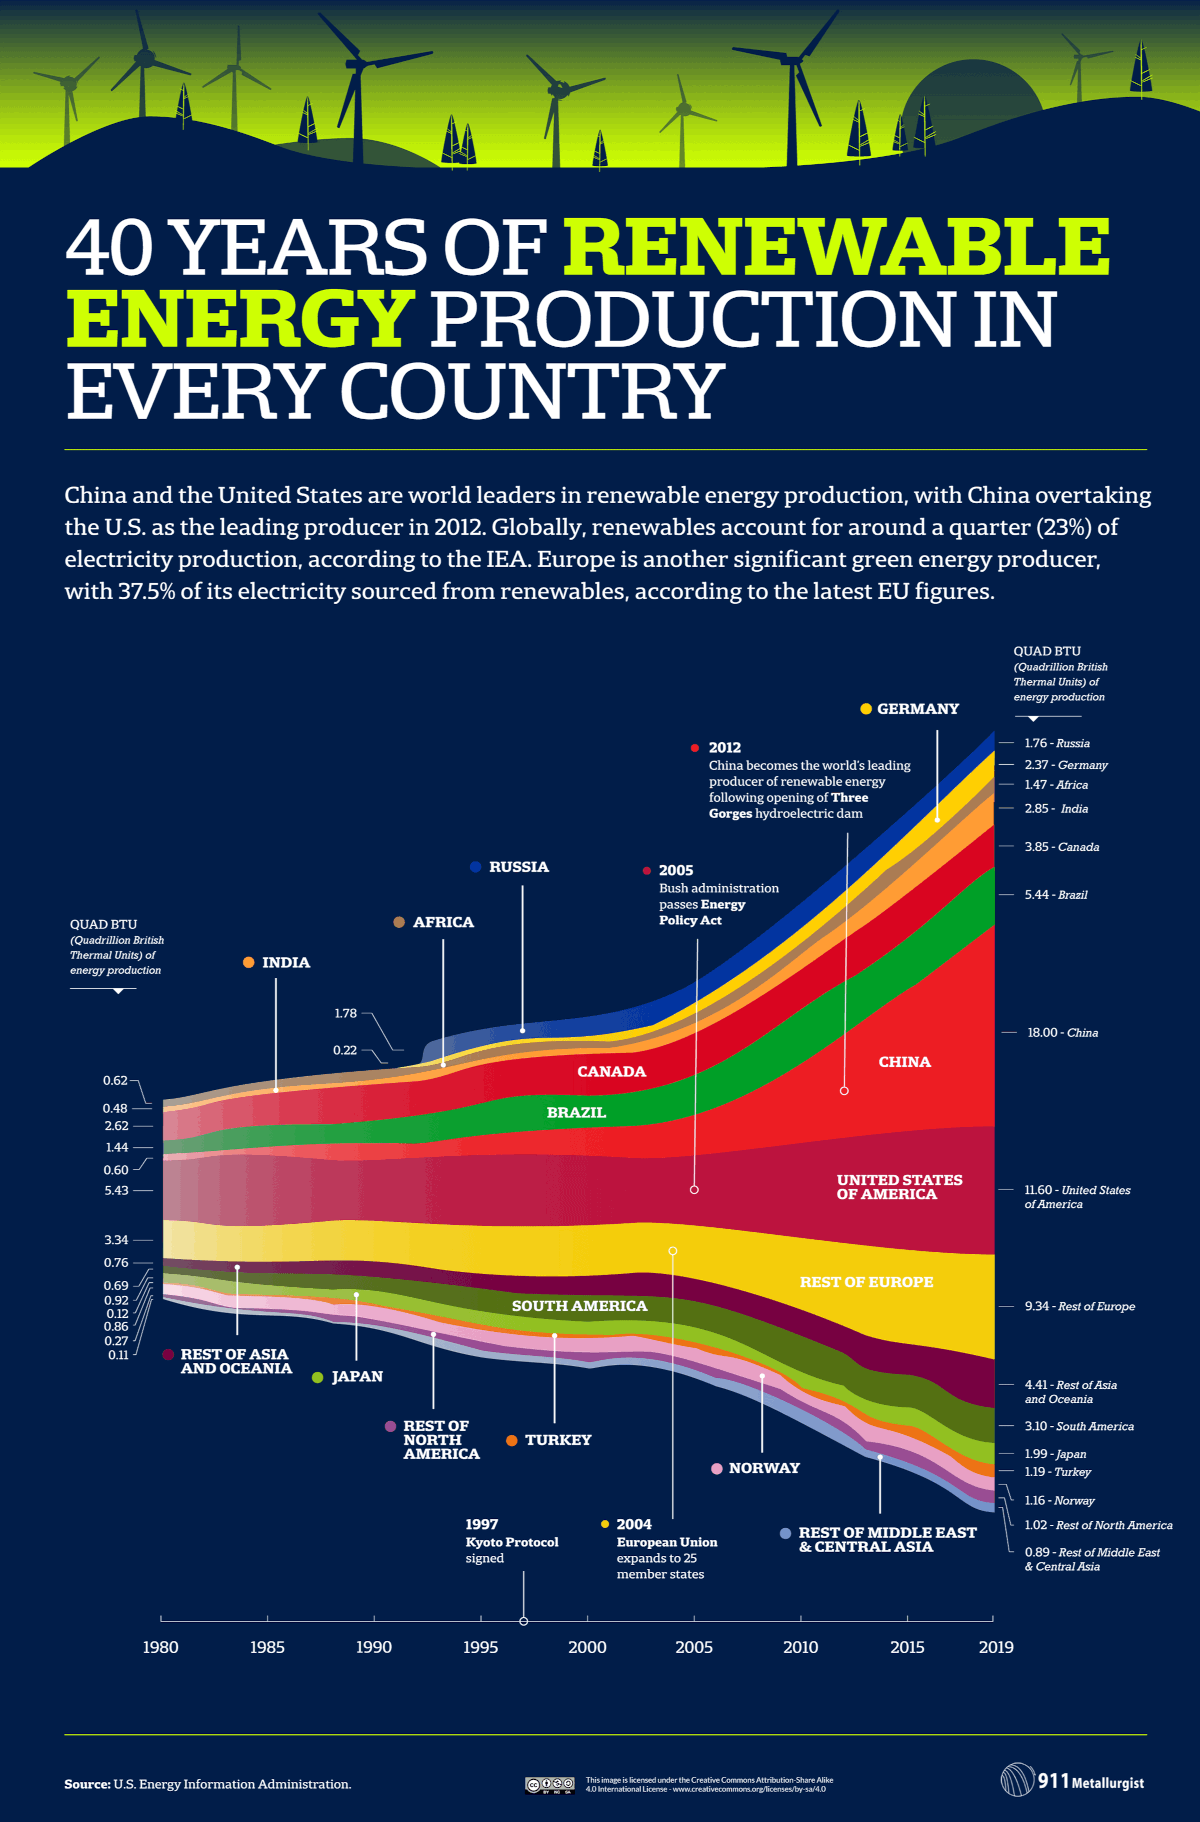
Renewable energy sources (including wind, hydro, and solar) account for about 23% of electricity production worldwide. China leads the front on renewable production, while the U.S. comes in second place.
While renewable energy production has ramped up in recent years, more countries will need to ramp up their renewable energy production in order to reach net-zero targets by 2050.
A Lifetime’s Consumption of Fossil Fuels, Visualized
Visualizing the Fossil Fuels we Consume in a Lifetime
This was originally posted on Elements. Sign up to the free mailing list to get beautiful visualizations on natural resource megatrends in your email every week.
From burning natural gas to heat our homes to the petroleum-based materials found in everyday products like pharmaceuticals and plastics, we all consume fossil fuels in one form or another.
In 2021, the world consumed nearly 490 exajoules of fossil fuels, an unfathomable figure of epic proportions.
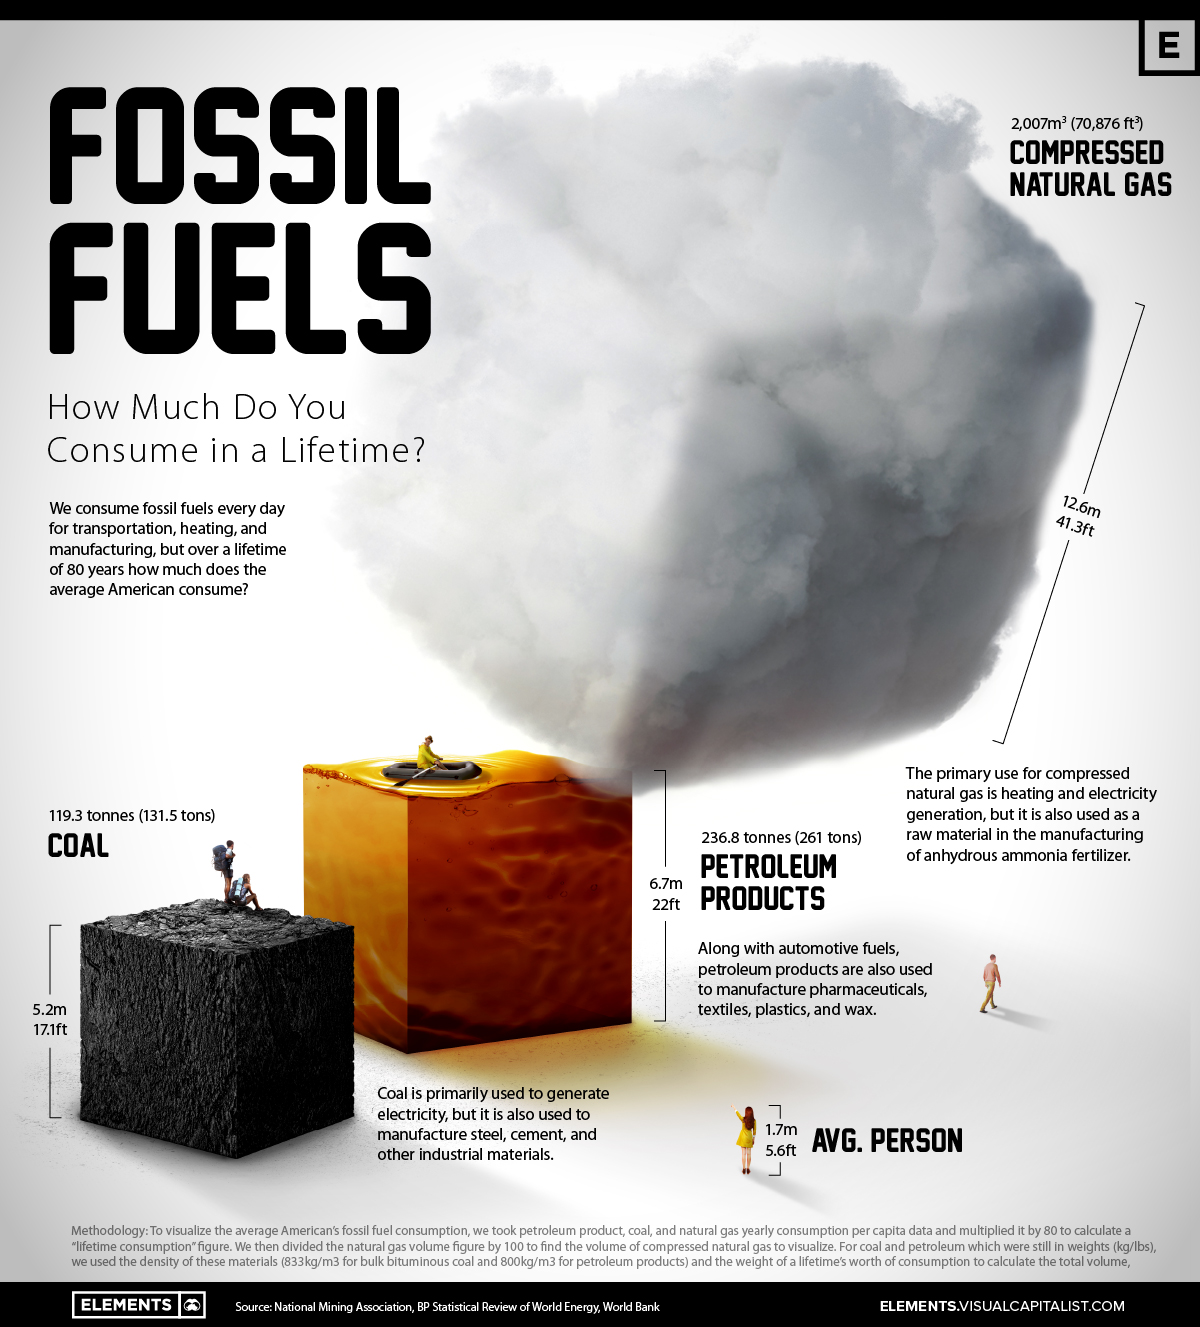
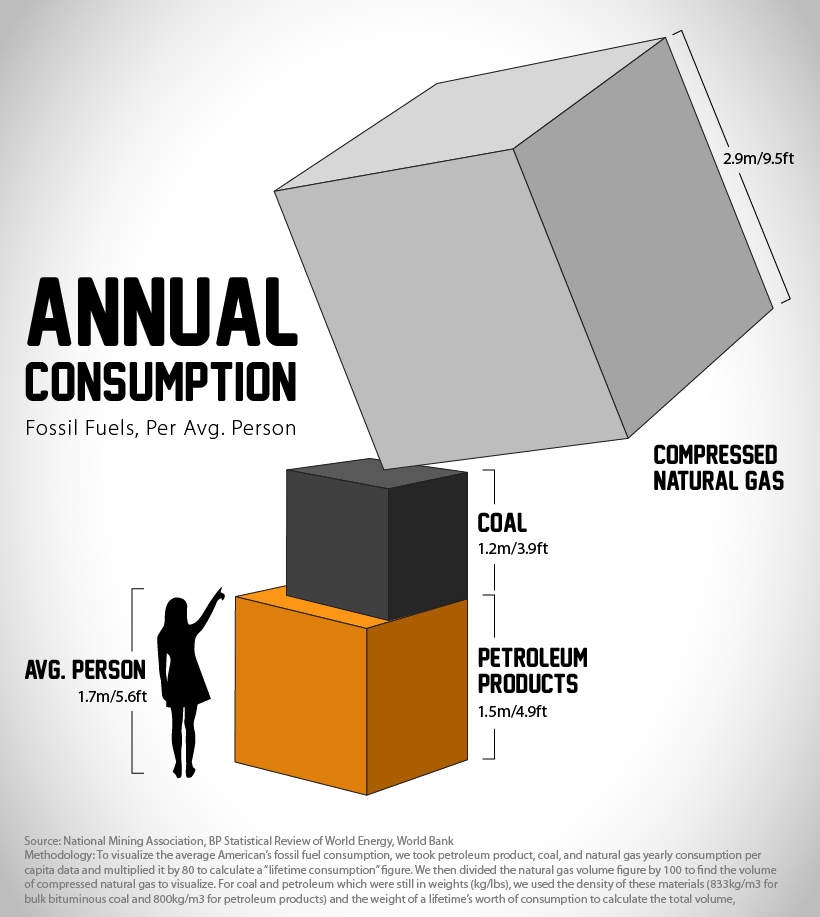
To put fossil fuel consumption into perspective on a more individual basis, this graphic visualizes the average person’s fossil fuel use over a lifetime of 80 years using data from the National Mining Association and BP’s Statistical Review of World Energy.
How Many Fossil Fuels a Person Consumes Every Year
On a day-to-day basis, our fossil fuel consumption might seem minimal, however, in just a year the average American consumes more than 23 barrels of petroleum products like gasoline, propane, or jet fuel.
The cube of the average individual’s yearly petroleum product consumption reaches around 1.5 meters (4.9 feet) tall. When you consider varying transportation choices and lifestyles, from public transit to private jets, the yearly cube of petroleum product consumption for some people may easily overtake their height.
To calculate the volume needed to visualize the petroleum products and coal cubes (natural gas figures were already in volume format), we used the densities of bulk bituminous coal (833kg/m3) and petroleum products (800kg/m3) along with the weights of per capita consumption in the U.S. from the National Mining Association.
These figures are averages, and can differ per person depending on a region’s energy mix, transportation choices, and consumption habits, along with other factors.
Global Fossil Fuel Consumption Rebounds Post-Pandemic
When the global economy reopened post-pandemic, energy demand and consumption rebounded past 2019 levels with fossil fuels largely leading the way. While global primary energy demand grew 5.8% in 2021, coal consumption rose by 6% reaching highs not seen since 2014.
In 2021, renewables and hydroelectricity made up nearly 14% of the world’s primary energy use, with fossil fuels (oil, natural gas, and coal) accounting for 82% (down from 83% in 2020), and nuclear energy accounting for the remaining 4%.
Recent demand for fossil fuels has been underpinned by their reliability as generating energy from renewables in Germany has been inconsistent when it’s been needed most.
Now the country grapples with energy rations as it restarts coal-fired power plants in response to its overdependence on Russian fossil fuel energy as the potential permanence of the Nord Stream 1 natural gas pipeline shutdown looms.
Growing Green Energy Amidst Geopolitical Instability
Domestic energy and material supply chain independence quickly became a top priority for many nations amidst Russia’s invasion of Ukraine, Western trade sanctions, and increasingly unpredictable COVID-19 lockdowns in China.
Trade and energy dependence risks still remain a major concern as many nations transition towards renewable energy. For example, essential rare earth mineral production, and solar PV manufacturing supply chains remain dominated by China.
Despite looming storm clouds over global energy and materials trade, renewable energy’s green linings are growing on the global scale. The world’s renewable primary energy consumption reached an annual growth rate of 15%, outgrowing all other energy fuels as wind and solar provided a milestone 10% of global electricity in 2021.
If the global energy mix continues to get greener fast enough, the cubes of our personal fossil fuel consumption may manage to get smaller in the future.
图表:40 年的全球能源生产,按国家/地区分类
能源在 2022 年之前就已经是一个热门话题,但飙升的家庭能源账单和生活成本危机使其更加引人注目。
哪些国家是最大的能源生产国,他们生产什么类型的能源?这张由911 Metallurgist制作的图表 提供了全球能源生产的细分,显示了自 1980 年以来哪些国家/地区使用了最多的化石燃料、核能和可再生能源。
所有数字均指英热单位 (BTU),相当于将一磅水加热一华氏度所需的热量。
编者注:单击任何图形可查看更高分辨率的全角版本
1. 化石燃料
查看 全尺寸 信息图
美国是石油和天然气生产的主导者,而中国是世界上最大的化石燃料生产国,这在很大程度上是因为其 煤炭的大量生产和消费。
在过去十年中,中国使用的煤炭比世界其他地区 加起来还要多。
然而,值得注意的是,自从政府 于 2014 年启动一项有助于减少碳排放的五年计划以来,该国的化石燃料消耗量和产量近年来有所下降。
2. 核电
查看 全尺寸 信息图
迄今为止,美国是世界上最大的核能生产国,产生的核能大约是第二大核能生产国法国的两倍。
虽然核能是化石燃料的无碳替代品,但 福岛的核灾难 导致许多国家放弃了这种能源,这就是近年来全球使用量下降的原因。
尽管许多国家最近都放弃了核能,但它仍然为世界提供约 10% 的电力。核能也有可能在未来的能源结构中发挥更大的作用,因为脱碳已成为世界各国的首要任务。
3.可再生能源
查看 全尺寸 信息图
可再生能源(包括风能、水能和太阳能)约占全球发电量的 23%。中国在可再生能源生产方面处于领先地位,而美国位居第二。
尽管近年来可再生能源产量有所增加,但更多国家将需要增加可再生能源产量,以便到 2050年实现净零排放目标。
可视化一生的化石燃料消耗
可视化我们一生消耗的化石燃料
这最初发布在 Elements上。注册 免费邮件列表 ,每周在您的电子邮件中获得关于自然资源大趋势的精美可视化。
从燃烧天然气来为我们的房屋取暖,到在药品和塑料等日常产品中发现的石油基材料,我们都以一种或另一种形式消耗化石燃料。
2021 年,世界消耗了近 490 艾焦的化石燃料,这是一个难以估量的史诗级数字。
为了从更具体的角度来看待化石燃料的消耗,这张图表使用了来自美国国家矿业协会 和 BP 的世界能源统计评论的数据,可视化了一个人 80 年的平均化石燃料使用量 。
一个人每年消耗多少化石燃料
在日常基础上,我们的化石燃料消耗量似乎很少,但是,在短短一年内,美国人均消耗超过 23 桶石油产品,如汽油、丙烷或喷气燃料。
人均年石油产品消耗量的立方体高达 1.5 米(4.9 英尺)左右。当您考虑不同的交通选择和生活方式时,从公共交通到私人飞机,某些人每年消耗的石油产品的立方体可能很容易超过他们的身高。
为了计算可视化石油产品和煤块(天然气数据已经采用体积格式)所需的体积,我们使用了散装烟煤 (833kg/m 3 ) 和石油产品 (800kg/m 3 ) 的密度以及美国国家矿业协会的人均消费权重。
这些数字是平均值,可能因人而异,具体取决于地区的能源结构、交通选择、消费习惯以及其他因素。
全球化石燃料消费在大流行后反弹
当全球经济在大流行后重新开放时, 能源需求和消费 反弹超过 2019 年的水平,其中化石燃料在很大程度上处于领先地位。虽然 2021 年全球一次能源需求增长了 5.8%,但煤炭消费量增长了 6%,达到 2014 年以来的最高水平。
2021 年,可再生能源和水电占世界一次能源使用量的近 14%,化石燃料(石油、天然气和煤炭)占 82%(低于 2020 年的 83%),核能占其余4%。
最近对化石燃料的需求得到了可靠性的支持,因为 在最需要的时候,德国的可再生能源发电 一直不稳定。
现在 ,由于 Nord Stream 1 天然气管道关闭的潜在永久性迫在眉睫,该国 在重启燃煤电厂以应对其 对俄罗斯化石燃料能源的过度依赖时,正努力解决能源配给问题。
在地缘政治动荡中发展绿色能源
在俄罗斯入侵乌克兰、西方贸易制裁以及中国越来越难以预测的 COVID-19 封锁期间,国内能源和材料供应链的独立性迅速成为许多国家的首要任务。
随着许多国家向可再生能源转型,贸易和能源依赖风险仍然是一个主要问题。例如,重要 的稀土矿生产和 太阳能光伏制造供应链 仍然由中国主导。
尽管全球能源和材料贸易乌云密布,但可再生能源的绿色衬里正在全球范围内增长。世界可再生一次能源消耗的年增长率达到 15%,超过所有其他能源燃料,因为风能和太阳能在 2021 年提供了具有里程碑意义的 10% 的全球电力。
如果全球能源结构继续以足够快的速度变得更环保,那么我们个人化石燃料消耗的立方体在未来可能会变得更小。

