Line graphs
上一节
下一节
Line graphs are usually used to show timeseries data (or other continuous variable e.g. distance), how one or morevariables vary over a continuous period of time.
In a line graph the x-axis (independent variable) represents the continuous variable (for example year or distance fromthe initial measurement) whilst the y-axis (dependent variable) has a scale andindicates the measurement.
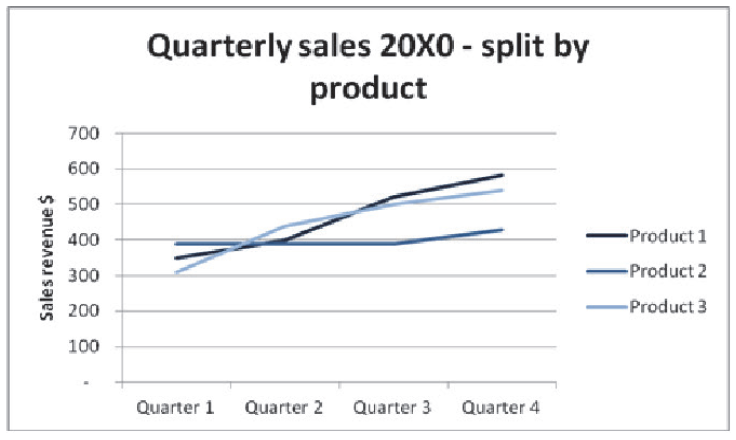
Several data series can be plotted on thesame line chart and this is particularly useful for analysing and comparing the trends in different datasets.
Line graphs (multiple line graph)