2013年真题
Directions:
Write an essay based on the following chart. In your writing, you should
1) interpret the chart, and
2) give your comments
You should write about 150 words.
命题解析
2013年为考研英语(二)大作文第四次考查图表作文,题目偏易。在2010/2011年考查“经济类”话题、2012 年考查“管理类”话题之后,2013 年考查了考研写作四大必考话题之“教育文化类”话题,主题是“某高校学生兼职情况”。
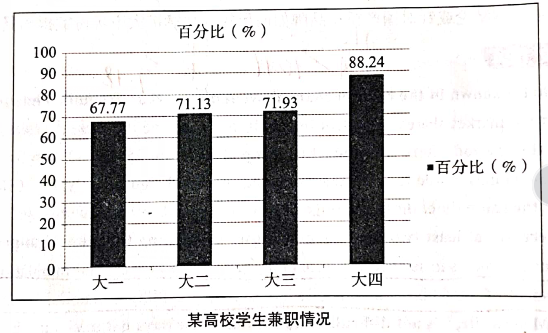
本文首段应描述图表:首句进行总体描述,点出“主题”(兼职情况)及 “对象”(某高校学生);其次应进行细节描述:大一至大三缓慢增加、大四急剧增长,并说明具体数据:首段无需发表议论。次段应进行利弊说明,详细闸明大学生粮职的利与弊,并给出充分的证据来支持论点,也可使用举例、正反论证等多种论证手段。尾段应进行归纳总结或提出建议:只要大学生扬长避短、趋利避害,兼职将利大于弊。
鉴于考研写作“语言第一位、 结构第二位、内容第三位”的评判标准,阅卷教师最重视的还是考生的真实语言水平。本文观点可为大学生兼职利大于弊、弊大于利,也可支持各有利弊,只要能够自圆其说即可。只要语言地道、结构清晰、内容切题,就可取得理想的成绩。
之所以反复强调考研考生需“背诵、 默写、仿写”考研经典范文、实提高英语实力和写作水平,只有这样,在考场上才能融会贯通,以不目的就是帮助考生扎扎实变应万变。无论命题如何变化,扎实的语言功底永远是取得写作高分的关键。即使有的考生侥幸押题成功,但如果套用相同范文或现场发挥时错误百出,仍然会得低分。
经典范文
The bar chart clearly reveals the statistics of students taking part-time jobs in a certain university. According to the survey, there has been a steady increase from 67.77% to 71.93% of students from freshmen to juniors holding temporary jobs, while the percentage of seniors working part-time has jumped markedly to 88.24%.
While part-time work does have the potential to negatively affect college students' studies, it can also be good for their future careers. It's obvious that doing a part-time job can adversely affect students' studies because it drains their energy. Part-time employment can also be detrimental to students by damaging their incentive to study. Despite the above disadvantages, working part-time on campus also offers several potential benefits. For one, it can help students better understand their preferences or to test out a possible career direction. Additionally, companies seeking to recruit fresh graduates will give preference to those with part-time experience.
In the end, the impact of part-time work on students' academic performance depends on their ability to maintain a balance between their studies and the part-time job. If students are able to manage their time effectively and secure a part-time position in a field related to their studies or interests, the job is certain to yield a positive impact.
参考译文
这幅柱状图清晰地反映了某高校学生兼职情况的数据。调查显示,从大一到大三, 兼职学生的比率从67.77%稳步上升到71.93%,而大四兼职学生的百分比则急剧上升到88.24%。
尽管兼职可能会对大学生的学习有些负面影响,但也对他们未来的工作有益。很明显,兼职会影响学生学业,因为兼职会消耗学生的精力。兼职对学生不利的另一方面是,它会破坏学生的学习动力。尽管有以上弊端,但在大学阶段做兼职还是有很多好处的。首先,兼职能帮助学生更好地了解自己的喜好或检验一种可能的职业方向。其次,那些招聘应届毕业生的公司会优先选择有兼职经验的大学生。
总之,兼职对大学生学业的影响取决于他们是否能够平衡花在学习和兼职上的精力。假如他们能有效管理自己的时间,找到符合自已所学或兴趣的兼职岗位,那么兼职必定会对他们产生积极的影响。
2014年英语(二)写作真题详解
Directions:
Write an essay based on the following chart. In your essay, you should
1) interpret the chart, and
2) give your comments.
You should write about 150 words on the ANSWER SHEET.
命题解析
城镇人口增长最主要的原因就是经济发展;乡村人口减少的最主要原因就是科技进步,政府扶持也是其中的重要原因,这都是经济问题常见的一些原因。
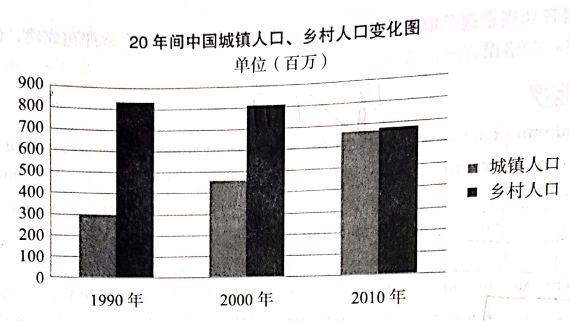
本题虽然只有两点提纲,但最好写成三段,首段为图表描述,次段为原因列举,尾段归纳结论或建议措施。首段一般写三句左右,首句进行总体描述,点出图表的主题(城镇人口和乡村人口变化)+对象(中国)+时间(1990-2010),注意先后顺序不要写错。其次进行细节描述,每个对象各写一句,描述图表有三大要素:时间+数据+变化。抓住最有特点的时间和数据:从1990到2010年,中国城镇人口从3亿急剧上升至6.6亿;相反,乡村人口从8.2亿急剧下降到6.7亿。
首段应以描述为主,最好不要发表任何议论。次段一般为原因列举段,最好列举两至三点原因。考生切记,考研图表作文与雅思图表作文迥然不同:雅思图表作文只需描述图表,无需发表议论;而考研图表作文重在发表议论,切勿描述太多!很多考生只知描述,议论太少,只能导致写作低分。第二段是图表作文的重点所在,首句是主题句,可使用图表作文常用句型,“这个问题有如下几点原因”,其次进行因果论证,最好写出两至三点城镇人口增长或乡村人口减少的具体原因。尾句可以进行小结,概括论证,总结本段。
第三段一般为建议措施或归纳结论段,写2-4句即可,首句为结论句,亦即第三段的主题句,其次发表两句评论或提出两点建议:本图为正面现象,但有利有弊,这种趋势将得以继续。最后进行小结。最好避免使用过于模板化的表达,政府制定法律、人民提高意识等万能建议对于本题并不适用。最好是写一和题目较为契合的句子,使教师有眼前一亮的感觉,这样才容易斩获高分。
很多考生未能写对关键词,或略有跑题,也无需过于担心。只要语言基本正确、结构比较清晰、内容没有太偏、书写较为整洁,均可取得较为理想的成绩。但如果只是考前突击使用万能模板,主题词根本无法写出,原因列举一塌糊涂,低级错误层出不穷,一般会取得低分。
经典范文
The bar chart above clearly reflects the changes in the statistics of the urban and rural populations in China during the past two decades. For urban dwellers, there was a noticeable jump of 360 million--from 300 million to 660 million--between 1990 and 2010. By contrast, a remarkable decline occurred in the rural population, by 150 million, from 820 million to 670 million during the same period.
At least three primary contributing factors account for these changes. First and foremost, there is a much nicer choice of options available in cities and towns. There are more jobs to choose from, and more different kinds of companies and types of work. In addition, big cities offer much more excitement and stimulation partly as a result of all the various options available in many areas. Most importantly, people prefer to live in cities and towns for the convenience of the transportation systems. They usually have well developed bus, subway, highway and airport transportation networks.
Generally speaking, people in expanding numbers would prefer to live in cities and towns which offer a rich variety of many options, whether it is for jobs, leisure, cultural or intellectual activities. At the same time, people like the energy and stimulation of a big city environment and the convenience of a well-developed transportation system.
参考译文
上述柱状图清晰地揭示了过去二十年之间中国城镇和乡村人口数据发生的变化。自1990到2010年,城镇人口从3亿急剧上升到6.6亿,增加了3.6亿。相反,在同一时期,乡村人口的数量发生了急剧下降,从8.2亿减少到6.7亿,减少了1.5 亿。
至少三个主要原因造成了上述变化。首先且最重要的是,几乎在所有的城镇,都有许多更好的选择。有更多可供选择的工作,以及更多不同的公司和工种。其次,大城市可以提供更多令人感到兴奋、刺激的事物,部分原因就是由于在这些地方有各种各样的选择。最为重要的是,由于交通系统的便捷性,人们更喜欢住在城镇。城镇通常有更为发达的公交、地铁、高速、机场等交通网络。
总之,越来越多的人更愿意选择居住在城镇。城镇可以提供丰富的选择机会,无论是工作娱乐、文化还是智力活动方面。同时,人们喜欢大城市的活力和刺激,以及高度发达的交通系统所带来的便利。
教育文化类:教育回报(2012年12月四级真题)
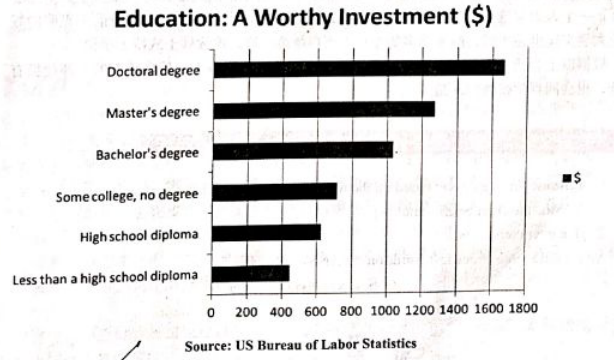
Directions: Write an essay entitled “Education Pays" based on the statistics provided in the chart below (Weekly earnings in 2010).
You should give a brief description of the chart first and then make comments on it.
经典范文
The bar chart above clearly illustrates the weekly earnings of people with different educational backgrounds in the United States in 2010. According to the data from the US Bureau of Labor Statistics, there was a steady increase in average earnings with educational level, ranging from $444 for people with less than a high school diploma to $1670 for those with doctoral degrees.
The reasons for this trend are as follows. In the first place, it has long been an accepted fact that a higher degree is a pre-requisite for finding a good job or a promising career. Having a career implies a progression in one's work life, whereby one can progress into increasingly responsible positions with a steady increase in pay. In the second place, in our highly competitive society, whether in China or the US, it can be said that it is hardly possible for a person to find a good job with a promising future without at least a college degree. Even a bachelor's degree is not always enough, and increasingly more and more young people are continuing on for their master's or doctoral degrees.
From the analysis given above, we may predict that in order to remain competitive in the workplace, people in mounting numbers will return to school to continue their educations, even though they already have their college or university degree.
参考译文
上述柱状图清晰显示了2010年美国不同教育背景人群的周薪数据。根据美国劳工统计局的数据,根据受教育水平不同,平均周薪从高中以下文化程度人群的444美元稳步上升到博士学位拥有者的1670美元。
存在这一趋势的原因如下:首先,拥有更高的学位是找份好工作或拥有光明职业前景的前提条件,这是大家长期以来公认的事实。拥有一份职业意味着职业生涯上的一大进步,之后才可以担任更高的职务,薪水也会相应地增加。其次,无论是在中国还是美国,在当今竞争愈发激烈的社会,一个人如果连大学文凭都没有,那么就可以说他几乎不可能找到一份 前途光明的好工作。甚至大学文凭也还不够,越来越多的年轻人正在继续深造,攻读硕士或博士学位。
根据以上分析,我们可以预测:为了保持在职场上的竞争力,越来越多的人即使拥有了大学文凭,也会回到学校继续深造。
Directions: Write an essay based on the following chart. In your writing, you should
1) interpret the chart and
2) give your comments.
You should write at least 150 words. Write your essay on the ANSWER SHEET.
经典范文
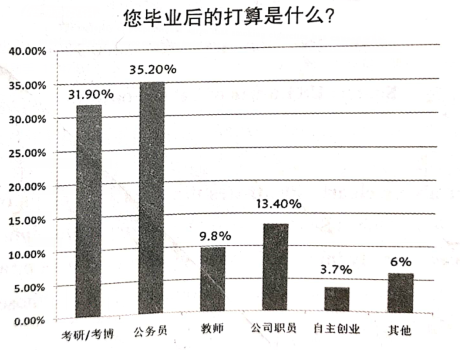
The bar chart above reflects what college graduates plan to do after graduation. As can be seen from the diagram, 35. 20% of undergraduates plan to take the civil servants examination and 31.90% of them plan to take the test for graduate students, each accounting for approximately a third of the total.
When making this decision, students should consider a variety of factors, including their career plans, financial status and personal preferences. The first factor that undergraduate students should consider when deciding between postgraduate studies and work is their intended career. Students should do the necessary research to find out whether, and to what extent, job prospects for their intended line or work would improve with a postgraduate education. The second factor that students deciding between postgraduate education and employment should take into account is their financial situation. Scholarships and loans may be available to some students, and these should also be taken into consideration when assessing whether one has ability to bear the costs of graduate studies. The final factor that undergraduate students should consider when deliberating between work and further education is their own personal preferences. These individual preferences should be given due consideration as students approach the end of their undergraduate education.
Generally speaking, by taking career goals, financial status and personal preferences into consideration, students can improve their chances of making an optimal choice.
参考译文
上述柱状图揭示了大学毕业生毕业之后打算做什么。如图表所示,35.20% 的大学生计划考公务员,31.90% 的大学生计划考研或考博,各占总数的大约三分之一。
在做决定的时候,学生应该考虑很多因素,包括职业规划、经济状况以及个人偏好。大学生在决定读研还是工作时,第一个应该考虑的因素就是自己期望的职业。大学生应该详细调查一下研究生学历能否及能在多大程度上有助于自己预期行业的职业发展。大学生在决定要读研还是工作时,第二个要考虑的因素就是自己的经济条件。有些学生可以申请奖学金以及贷款,在衡量自己是否有能力支付学费时,这些也可以考虑进去。大学生在读研还是工作两者之间权衡所需要考虑的最后一个因素就是自己的个人偏好。大学生们在毕业之际要适当考虑个人的喜好。
总而言之,通过综合考虑职业目标,经济状况及个人的偏好,大学生就更有可能在就业和继续深造之间做出最优选择。
2015年英语写作真题详解
Directions:
Write an essay based on the following chart. In your writing, you should
1) interpret the chart and
2) give your comments.
You should write at least 150 words. Write your essay on the ANSWER SHEET.

解析
最好写成三段,首段描述图表,首句应为总体描述:主题(春节假期花销比例) +对象(我国某市居民)。次句应为细节描述,分别描述占比最高的新年礼物和其次的交通、聚会吃饭与其他。第二段最好写成原因列举。首句可为主题句,承上启下进行过渡。其次具体说明二至三点原因,可写为何新年礼物花销最大或交通、聚会吃饭也占据一些比例。第三段可预测图表发展趋势、归纳结论或提出建议措施。
经典范文
The pie chart above clearly illustrates the percentage of the residents' spending in a certain city of China during the Spring Festival Vacation. From the statistics given, we may draw the conclusion that the spending on New Year presents is the highest among all the four categories, at approximately 40%, whereas the amount spent on transport, gathering and dining, and miscellaneous accounts for about 20% each.
The fundamental factors that contribute to the aforementioned comparison may be summarized as follows. To start with, a New Year gift must be memorable because of the special occasion when it is given. If the present is something that only your best friend knew you had wanted, you will never forget it, since it shows the closeness of your relationship with that fiend. In addition, festival presents might be unforgettable since they are related to significant events in your life. For instance, I still remember the first New Year gift my best friend, Leo, gave me.
In summary, people spend a lot on Spring Festival presents for a large number of reasons. Some gifts might be memorable owing to the special person who gave the gift. Others are unforgettable due to the significance of the event. Most of all, it is easy to remember special presents as they give you a significant sense of personal worth.
参考译文
上述饼状图清楚地揭示了中国某市居民春节假期的花销比例。根据给出的数据,我们可以得出结论:新年礼物所占的开支在四种类别中最高,大约为40%;而交通、聚会吃饭和其他的开支比例各占20%。
造成上述对比的主要原因可以概括如下:首先,一份春节礼物之所以令人难忘,是因为送礼物的时机本身很特别。如果只有最好的朋友才知道你想要那份礼物,并把它送给了你,你一辈子都不会忘记,因为这份礼物代表着你们两人深厚的友谊。其次,春节礼物之所以令人难忘,是因为这些礼物与生命中的重大事件相关。比如,我还记得我最好的朋友列奥送给我的第一份新年礼物。
总之,人们在新年礼物上花销巨大是出于多种原因。有些礼物之所以令人难忘,是因为送礼物的人本身很特别;有些礼物则是因为与重大事件有关。而最重要的原因是特别的礼物会带给你无比的自尊。
2017年英语写作真题详解
命题解析
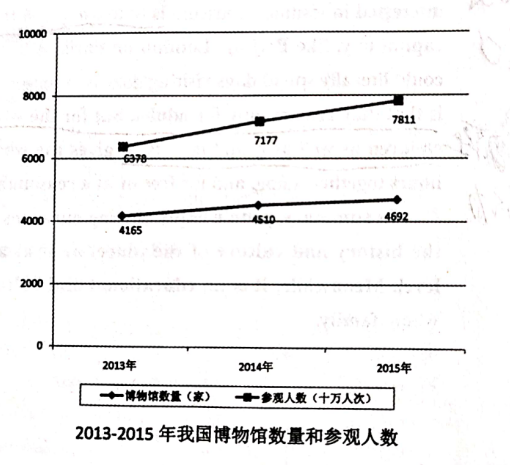
本文第一段应进行图表描述,首句为总体描述,说明主题(博物馆及参观人数)+时间(2013-2015)。第二、三两句进行细节描述,博物馆数量和参观人数各写一句,时间( 2013-2015)+主题(博物馆数量和参观人数)+数据(最小及最大数据) +变化(急剧上升)。
第二段可以进行原因列举,说明数据变化原因,有两种写法:一是每个对象写一点原因,博物馆数量和参观人数增加分别写一点原因;二是主要对象写两到三点原因,写博物馆数量或参观人数增加其中之一均可。
第三段有三种写法:一是预测趋势,正面继续,负面变化,本图是正面现象,博物馆数量和参观人数仍将继续猛增;二是归纳结论;三是建议措施,呼吁政府多建博物馆,人们多参观博物馆。
范文
The line graph clearly illustrates that the number of museums in China and their number of visitors both increased remarkably between 2013 and 2015. Based upon the data given in the picture, we can see that the number of museums has risen dramatically from 4,165 to 4,692 during the three years, while the amount of visitors jumped from 637 million to 781 million in the same time.
Museums hold an attraction and fascination for most people, of all ages, from young children to the elderly, for at least two fundamental reasons. The first reason many people are interested in visiting a museum is to learn about the history and culture of a place. A country's capital city, like Beijing, London or Paris, is a veritable museum lover's paradise, where one could literally spend days visiting dozens of museums. Another reason why people visit museums is that they are not only for adults, but for the whole family, a wonderful activity enjoyed by children as well as grandparents. It gives the whole family something they can spend several hours together doing, and for free or at a reasonable cost.
In summary, people enjoy visiting museums because doing so helps them to understand the history and culture of the place, be it at a local, regional, national or international level. Meanwhile, it is an educational and cultural experience that can be enjoyed by the whole family.
参考译文
这幅线状图清晰地显示,从2013年到2015年,中国博物馆的数量和参观人数均急剧上升。根据上述数据,我们可以看出在这三年中,博物馆的数量从4165所迅猛增加至4692所,而与此同时,参观人数的数据从6.37亿急剧上升至7.81亿。
博物馆吸引着大多数人,从小孩到老人,各个年龄层的人无不为博物馆着迷,至少有两个根本原因。第一个原因,许多游客对参观博物馆感兴趣是为了了解当地的历史和文化。一国的首都,如北京、伦敦或巴黎,简直就是博物馆爱好者的天堂,一个人可以花数天时间参观许多博物馆。另一个原因,参观博物馆不仅是成年人的消遭,还是全家人的极好的活动,老人和小孩都喜欢。不管是免费还是得花合理的费用,参观博物馆给一家人提供了好几个小时待在一起的机会。
总之,人们喜欢参观博物馆,无论是 当地、地区级、国家级还是世界级的博物馆一-是因为它能帮助他们了解当地的历史和文化。同时,全家人去逛博物馆也是一件乐事,能从中学到知识,感受文化。
社会热点类:交通问题(2007年MBA真题及英语(=)大纲样题
经典范文
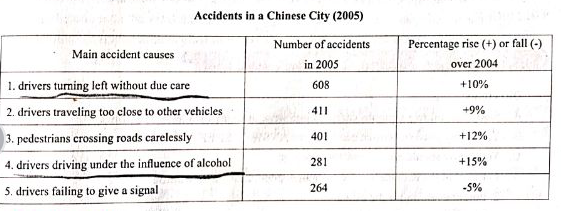
The table above clearly reflects the statistics of traffic accidents happening in a Chinese city. According to the table, in 2005, the traffic accidents in the Chinese city still failed to arouse concerns among both drivers and pedestrians.
The number of accidents that resulted from drivers turning left without due care increased 10 percent to 608, which is highlighted on the first row of the table. Accidents related to drivers driving under the influence of alcohol rose by 15%, which is the greatest rise among the listed five causes. In comparison, those pedestrians who were careless when crossing roads also led to 401 accidents. By analyzing these factors displayed in the diagram, we may draw the conclusion that both drivers and pedestrians have little respect for traffic regulations.
As has been mentioned above, countermeasures should be taken immediately so as to reverse the grim situation. First of all, relevant laws and regulations should be established to severely punish those who violate traffic rules openly, be they drivers or pedestrians. Furthermore, a widespread education campaign should be launched to inform citizens that proper rules are of benefit to public safety. Only by doing so can we exist in a harmonious and disciplined society.
参考译文
上述图表清楚地反映了中国某市的交通事故数据。根据图表,在2005年,这座中国城市的通事故仍然没能引起司机和行人的关注。
源于司机左转时不够小心的事故数量增加了10%,达到608起,这在图表的首行非常显著,与司机酒后驾车相关的事故增长率高达15%,这在所列示的五大事故原因中增幅最大。同样,一些过马路不小心的行人也导致了401起事故。通过分析图表中所显示的这些原因,我们可以得结论,司机和行人都不太遵守交通法规。
综上所述,我们必须立即采取抵制措施来扭转这一严峻的形势。首先,我们应该制定相关律法规来严惩那些公然违反交通法规的人,无论他们是司机还是行人。其次,我们应该开展广泛的宣传活动来告知公众,适当的法规对公共安全有益。只有这样我们才能在一个和谐、守法的社会中生活。
环境保护类:保护野生物种(1999年考研真题)
Directions:
A. Study the flowing graphs carefully and write an essay in at least 150 words.
B. Your essay must be written neatly on the ANSWER SHEET.
C. Your easy should cover these three points:
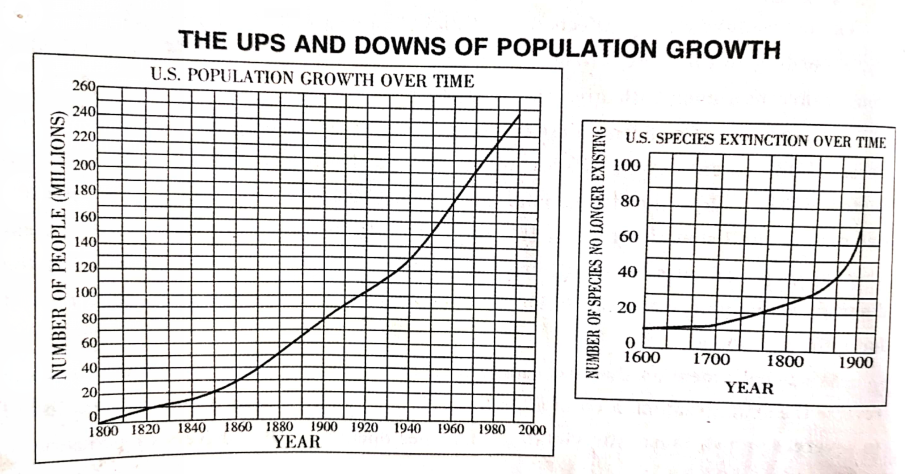
1. Effect of the country's growing human population on its wildlife.
2. Possible reason for the effect.
3. Your suggestion for wild life protection.
经典范文
Currently, there is widespread concern regarding the previously neglected connection between growing human populations and decreasing wild species. As the two graphs clearly portray, the American population in 1980 was 250 times than that of 1800, a trend accompanied by the extinction of nearly 70 kinds of wildlife in the past 300 years. A clear correlation is suggested: that mankind has exerted a tremendously negative influence on natural resources.
There are a great many causes responsible for the aforementioned correlation. To begin with, to satisfy the space demands of a booming population, the only available solution for Americans was to inhabit forests and grasslands that used to be the habitats of wild animals and plants. In addition, the process of industrialization and urbanization has generated severe pollution that essentially destroys environments and ecosystems.
From my point of view, the death of wild species today forecasts an unpromising future for humans tomorrow. In order to eliminate species extinction, relevant laws and regulations must be established and enforced to maintain large unspoiled areas. Drastic measures should also be applied to ensure that the impact of pollution is removed.
参考译文
近年来人们开始普遍关注以前被忽略的人口增长和自然物种减少之间的关系。正如两幅图表显示,1980年的美国人口是1800年的250倍,同时在过去的300年间大约有70种野生生物在美国灭绝。这清楚地表明人类给自然物种带来了巨大的负面影响。
以上提到的这种关联是由诸多原因造成的。首先,为了满足迅速增长的人口对于空间的需求,对于美国人来说唯一有效的解决办法就是占据森林和草原,而这些地方曾是野生动植物的栖息地。此外,工业化和城市化的进程造成了严重的污染,在根本上摧毁了环境和生态系统。
我认为,今天野生动物种类的灭绝和数量的减少预示着将来人类并不明朗的前景。为了减少物种灭绝,我们应该制定并执行相关的法律法规来保留大部分的原始生态区。同时,我们也应该采取有效的措施来确保消除污染的影响。
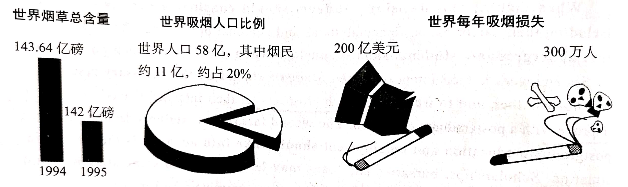
Directions: Widespread tobacco consumption has led to grave consequences, yet the tobacco companies still claim that they make a valuable contribution to the world economy.
There is a discussion in a newspaper on the above two viewpoints. Write an essay to the newspaper
1) criticizing their view, and
2) justify your stand.
In your essay, make full use of the information provided in the pictures below.
You should write about 200 words on the ANSWER SHEET:
经典范文
The majority of people would agree that smoking cigarettes has caused serious problems. But the tobacco companies insist that they contribute greatly to the world economy by paying taxes to the government and employing hundreds of workers.
Personally, I believe that cigarette production and consumption does more harm than good. Firstly, smoking is responsible for many fatal diseases such as lung cancer, heart diseases and so on. According to the survey, tobacco consumers account for about 20% of the world population, and among them, three million people die from smoking-related diseases every year. The fact that the output of tobacco production declined from 14.364 billion pounds in 1994 to 14.2 billion pounds in 1995 suggests that people have come to realize the negative effects of smoking. Secondly, tobacco consumption is extremely wasteful of money. As is indicated in the pictures, 200 billion US dollars is lost due to smoking each year. Obviously, the total loss of money around the globe substantially exceeds the gain in the industry.
In conclusion, as economic development aims at making our lives better, we cannot sacrifice our health for short-term financial benefit. If we have to spend more and more money providing medical services for those who suffer from smoking-related illnesses, the notion of promoting the economy via tobacco production becomes unjustifiable. It is high time that we fought for a total tobacco ban.
参考译文
大多数人认为吸烟已经导致了严重的问题。然而,烟草公司声称他们通过给政府纳税和雇用成百上千的工人,为世界经济做出了巨大的贡献。
个人而言,我认为烟草的生产和消费弊大于利。首先,吸烟是导致诸如肺癌、心脏病等很多致命疾病的原因。根据调查,烟民大约占世界人口的20%,而在他们中间,每年有300万人死于与吸烟相关的疾病。世界烟草总产量从1994年的143.64 亿磅下降到199年的142亿磅的事实,也证明了人们已经逐渐意识到了吸烟的负面影响。其次,烟草消费非常浪费金钱。如图所示,每年由于吸烟损失2000亿美元。显而易见,全球在金钱上的总损失明显超过了烟草业的收益。
总而言之,由于经济发展旨在改善人民生活,我们不能为了短期经济利益而牺牲健康。如果我们不得不花费越来越多的钱为那些受吸烟相关疾病所困扰的人群提供医疗服务的话,那么通过烟草生产来发展经济的观念就站不住脚了。我们早就该进行一场全面禁烟的战役了。
2011年英语(二)写作真题详解一
Directions:
Write an essay based on the following chart. In your writing, you should
1) interpret the chart and
2) give your comments.
You should write at least 150 words.
Write your essay on the ANSWER SHEET.
命题解析
继2010年考查关于“手机入网”的图表作文之后,2011 年考研英语(二)连续第二年考查图表作文。巧合的是,本题与英语(二)大纲样题同为关于汽车或交通问题的图表作文,有些表达可以借鉴。
2010年1月,日本丰田汽车召回事件举世关注,日系轿车形象一落千丈, 销量骤减。3月,中国吉利汽车集团收购沃尔沃再次震惊世界,中国国产品牌众人瞩目,销量日增。本题即考查“汽车”这一2010年热门话题。
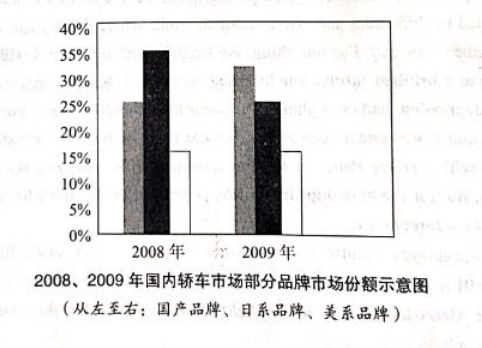
本题为两点提纲,第一点提纲应写成第一段图表描述,无需发表太多议论,就图论图进行描述即可。首句可进行总体描述,点出主题(国内轿车市场部分品牌份额) +对象(国产、日系、美系品牌) +时间( 2008- 2009年)。第二至三句进行细节描述,应该点出国产品牌份额急剧上升、日系品牌份额急剧下降、美系品牌份额保持平稳,并指出具体数据。
第二段可以分析原因并列举,最好从正反两个方面分析国产汽车份额上升、日系汽车份额下降的具体原因。一方面,由于国产轿车科技进步、价格上进行促销,从而销量大涨;另一方面,由于日系轿车深陷丑闻、涉嫌行业欺诈,从而丧失优势。
第三段可归纳结论或针对国产轿车品牌如何保持并继续扩大市场份额提出具体的建议和措施。
经典范文
What is shown in the bar chart above indicates that dramatic changes have taken place in the market shares of certain brands in the domestic car market from 2008 to 2009. During that period, there was a marked jump of 8% from 25% to 33% in the market shares of Chinese brands, while that of Japanese brands declined significantly, by 10% from 35% to 25%. At the same time, the percentage of American brands remained steady.
There are at least two fundamental causes accounting for these changes. On the one hand, advancements in science and technology have offered a technical foundation for the rapid development of the Chinese automobile industry by providing a material basis and technical means. Meanwhile, it's not difficult to notice that these days national auto mobile companies in mounting numbers have turned to price promotions to boost sales. On the other hand, the dishonest words and behaviors of Japanese automobile corporations such as Toyota in recent years have cheapened their image and finally ruined their reputation.
To sum up, brands are intangible treasure. They amount to a product's or a company's reputation. Obviously, if the Chinese automobile industry wants to make continuous profits, what it needs is to try promotions that will reinforce Chinese brands' images.
参考译文
上述柱状图中显示的数据表明,从2008年到2000年,国内轿车市场部分品牌市场份额发生了很大变化。在此期间,国产品牌的市场份额从25%急剧上升到33%,上升了8个百分点:而日系品牌的市场份额则从35%急剧下降到25%,下降了10个百分点。与此同时,美系品牌所占的百分比保持平稳。
至少两点主要原因造成了上述变化。一方面,科技进步通过提供物质基础和技术手段,为中国汽车产业的迅猛发展提供了技术基础。同时,不难发现,近年来越来越多的国产轿车公司大搁价格促销来提升销量。另一方面,近年来丰田等日系轿车公司的欺诈言行损害了其形象,并最终毁坏了其声誉。
总之,品牌是无形的财富。它们与一种产品或一家公司的声誉密不可分。显而易见,如果中国轿车产业想要继续赢利,需要尝试提升国产品牌形象的促销方式。