饼图(pie chart)实例
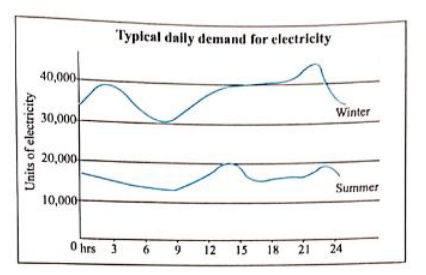
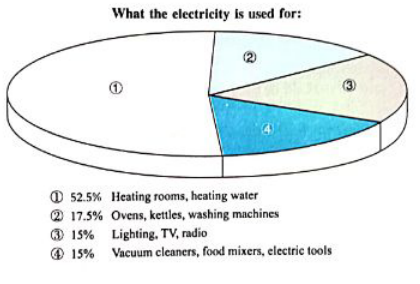
The graph below shows the demand for electricity in England during typical days in winter and summer. The pie chart shows how electricity is used in an average English home.
分析:
开头段可以立刻改写为:
The line graph compares the need for electricity in England during typical days in two seasons, while the pie chart illustrates how electricity is used in an average English household.
下面这个pie chart范例按照所占份额从大到小的顺序来描述饼图里面的各部分,这是描述饼图时最常见的顺序。同时,请特别注意一些短语,它们在介绍饼图各部分所占的百分比时极为有用:
It is clear that the electricity is used for four purposes, Heating rooms and water accounts for the highest proportion (52. 5%)(最大值) of the total amount of electricity used, while (对比) the running of ovens, kettles and washing machines constitutes 17. 5% of the total consumption of electricity. Lighting, TV and the radio represent the same proportion ( 15% ) of power consumption as vacuum cleaners, food mixers and electric tools do (图形里有完全相同或者非常接近的数字时别忘了进行类比).
高能预警:
① 上而这个主体段里的词汇(account for… , constitute…和represent…)是介绍各部分所点的百分比时特别常用的动词,在饼图里几乎是必用的一定要记熟:;
② 如果想用括号介绍数字是可以的,但要特别注意,括号里的数字应该放在它所对应名词的后面,而不是在名词前而,而且用括号介绍的数字也不要过多,作文里的多数数字还是应该用正常语序来介绍。例如:
The main causes were over-cultivation (3. 3% ) and over-grazing (2. 5%),(括号里的数字放在它所对应名词的后面)
1. 描述下列图表所表达的信息;
2. 谈谈你对此现象的看法.
3.根据此现象提出建议

Sample writing:
As we can see from the chart, on the top of the list is the number of working people seldom doing physical exercises, which accounts for 60%. What follows are working people doing exercises once a month at a percentage of 25%. On the bottom is the number of people doing regular exercises, which takes up only 15%.
Although more and more working people are realizing the importance of physical exercises, they cannot spare their limited time to do some exercises because of the heavy burden of supporting their families on their shoulders. Apart from that, their daily lives at the office cannot provide them with the exercise their body needs. Lack of physical exercises is one of the main contributing factors to poor health among the working people.
In order to stay healthy and concentrate on their work more efficiently, all people, especially working people should take some physical exercises. Society should encourage people to take exercises regularly. The problem of insufficient exercises among working people should be solved as soon as possible. (174 words)
又一个满分范例
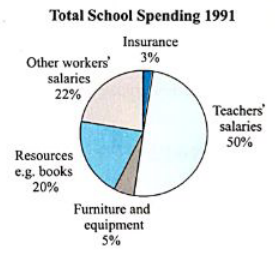
The charts below illustrate the annual spending (每年的开支) by a UK school in 1981,1991 and 2001.


分析:
对于含有多个“大饼”的考题,除了对每个饼各写一个主体段(这种写法的缺点是容易导致每一段介绍数据的过程雷同而比较枯燥)之外,我们也可以把每个饼里的对应元素提取出来进行比较。这样把每个饼里的对应元素提取出来写的好处是:我们可以立刻看出各类数据在不同年代之间的变化趋势。
开头段:
The pie charts show how much a UK school spent on different running costs in three separate years: 1981, 1991 and 2001.
主体段1:
It is clear that in all three years, teachers' pay accounted for (占…… the largest cost of running the school (把占百分比最高的教师工资数据提取出来集中介绍)。This cost increased from 40% to 50% of total spending between 1981 and 1991, and then fell slightly to 48% in2001 (对应提取的好处就是每一类数据的变化趋势能看得非常清楚).
By contrast (对比),although other workers' salaries represented the second highest cost in 1981 and 1991 (28% and 22% respectively) (把占百分比第二高的其它员工工资提取出未进行介绍,提取时也同样按照合理的顺序),the figure had decreased sgificantl'y to only 15% by 2001.
主体段2:
Spending on resources such as books (提取三个饼里“图书等资源”的开支) had increased from 15% to 20% by 1991, before it decreased to only 9% in 2001. The cost of furniture and equipment (开始提取三个饼里的家具和设备费用) saw an opposite trend; (对比,呈现出相反的趋势). This cost had declined from 15% to only5% of total spending by 1991, but rose dramatically in 2001 when it made up (make up的过去时,也表示....20% of the total spending. Similarly (看到明显的相似之处也别忘了类比), the cost of insurance saw a rising trend, growing from only 2% to 8% by 2001(占百分比最低的一类开支insurance 也提取完毕,1991 年的保险开支3%因为并不是特征点,所以就自然省路了,官方范文重视的是main features,不是“事无巨细")
结尾段:
Overall, teachers' salaries constituted (占…...) the largest cost to the school, and although spending increased dramatically for equipment and insurance, there were decreases in spending on things such as books and on other workers' salaries (结尾段就是对主体段的数据进行了整体概括,仍然不应该离开图里面明确给出的信息,不能“自由发挥").
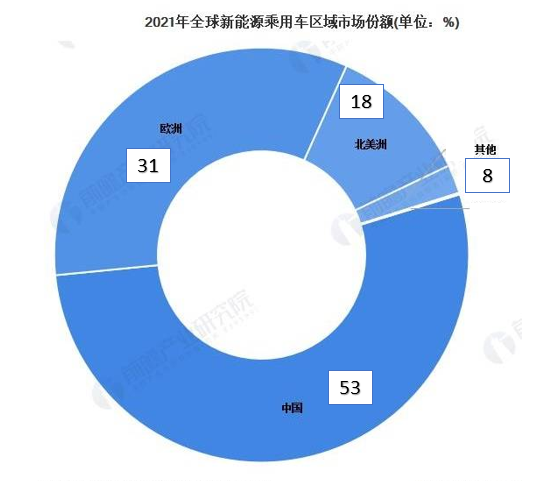
Before my presentation, I'd like to ask all of you a question. Which car do you prefer new energy vehicles or traditional oil cars? I believe everyone may choose the former. Now please look at this pie chart behind me. It clearly demonstrates the information regarding to the Global regional market share of new energy passenger automobiles in 2021. According to the data, we can see Chinese market share was the highest than other continents, which stood at 53%. However, China's market share was about twice that of Europe's 31%, three times that of North America's 18%, and more than five times that of the other continents' 8%, all of which together were only 57 %. Therefore, we may arrive at a conclusion that Chinese regional market share for new-energy passenger vehicles is only 4 % less than the global total. So, let's think about a question: how can it be?
It's a thought-provoking question. From my perspective, there are at least several fundamental factors contributing to this result. Firstly, the government has provided strong economic support for the development of new energy industry. For example, we have implemented taxes reduction and subsidies, which has offered economic convenience to both businesses and users. Secondly, new energy suppliers have seized the opportunity for green development and worked out world-class technologies. For instance, Great Wall Motor, Next EV and BYD all have started to make new energy cars and enjoy very good sales. Last but not least, the new energy vehicle is easy to charge. Just take the infrastructure as an example, the number of charging piles in China has reached 1.87 million by 2021, covering all provinces. In contrast, the total number of charging piles in developed countries in Europe and the United States combined is much less than that in China.
In my opinion, China is the only country in the world with all industrial categories. This includes all the industrial technologies that are relevant to the electric vehicle sector, such as the battery market. What's more, new energy vehicles are of great benefit to environmental protection, which will reduce environment pollution. As we have promised, China will strive to peak carbon dioxide emissions before 2030 and achieve carbon neutrality before 2060. I believe our government will continue to strongly support the new energy industry and spare no effort to meet these goals.