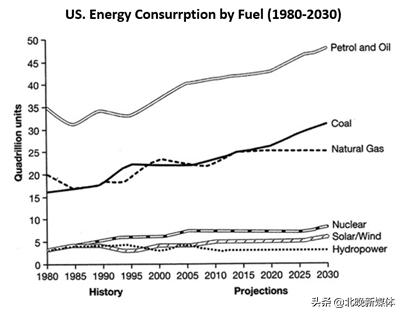
The graph shows energy consumption in the US from 1980 to 2012, and projected consumption to 2030.
Petrol and oil are the dominant fuel sources throughout this period, with 35 quadrillion (35q) units used in 1980, rising 42q in 2012. Despite some initial fluctuation, from 1995 there was a steady increase. This is expected to continue, reaching 47q in 2030.
Consumption of energy derived from natural gas and coal is similar over the period. From 20q and 15q respectively in 1980, gas showed an initial fail and coal a gradual increase, with the two fuels equal between 1985 and 1990. Consumption has fluctuated since 1990 but both now provide 24q. Coal is predicted to increase steadily to 31q in 2030, whereas after 2014, gas will remain stable at 25q.
1n 1980, energy from nuclear, hydro- and solar/wind power was equal at only 4q. Nuclear has risen by 3q, and solar/wind by 2. After slight increases, hydropower has fallen back to the 1980 figure. It is expected to maintain this level until 2030, while the others should rise slightly after 2025.
Overall, the US will continue to rely on fossil fuels, with sustainable and nuclear energy sources remaining relatively insignificant.
一、题目类型: 折线图-1个图-6线
二、题目简要内容:
关于美国自1980年至2030年能源消费及预测
三、素材积累:
petrol and oil 汽油和石油
coal 煤炭
natural gas 天然气
nuclear 核能
solar/wind 太阳能/风能
hydropower 水电
quadrillion n. 百万之四次方;千的五次方 adj. 千之五次方的
转折词: but,whereas,while
动词的多种形式表达:
“增加”的不同形式: rising, increase
“波动”的不同形式: fluctuation, fluctuate
“保持不变”的不同形式: remain stable,maintain this level
多种时态运用:
描写过去:
一般过去时:...gas showed an initial fall... 描写过去发生的,强调对现在的影响:
现在完成时:Consumption has fluctuated since 1990...
描写未来:
一般现在时表示推测:is expected to,is predicted to
四、论据积累:
在描写曲线图时,我们要先看看有几条曲线,根据横轴时间来分析各个曲线的变化,并把不同曲线进行比较分析。曲线较多时要进行归类,阐述的时候要根据其变化幅度的大小进行描述。
现在我们再来研究line graph的主体段怎样能写得更清晰、有秩序。
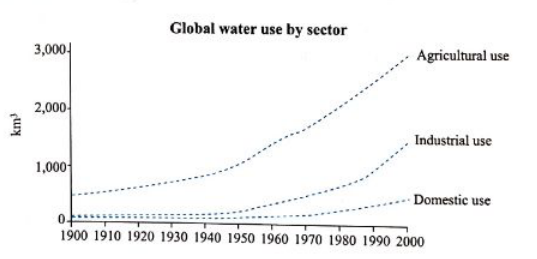
The graph and table below give information about water use worldwide and water consumption in two different countries.
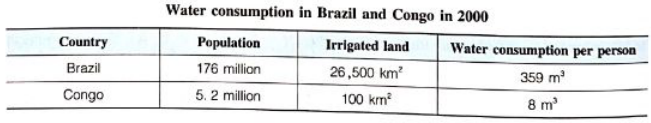
这道题里既有线图(line graph)又有表格(table), 可以分别各用一个主体段来介绍。
我们重点来看线图这个主体段怎样描述清晰。
这个线图里存在着时间变化(动态图),所以第1句就可以概括整体的变化趋势(本图是都上升)。在“X句" 里对起点、终点(正好也是最高点)等特征点不要漏掉,同时不要忘记适当比较。
主体段1:
It is clear from the line graph that the quantities of water used for agricultural, industrial and domestic purposes all increased between 1900 and 2000 (由于是动态图,所以本段第1句概括整体的变化趋势). In 1900, around 500km3 of water was used for agricultural purposes worldwide, while (比较起点的不同) the figures for industrial consumption and domestic water consumption stood at (位于... only around 100km3. From 1900 to 2000, global water use for agriculture rose dramatically to around 3000km3 (介绍明显的变化趋势:急剧地上升). By contrast (比较),global industrial water use increased to around half that amount (比较:增长至农业用水量的一半左右,不是准确的一半所以可以用around) and domestic consumption only reached (达到) around 500km3 (特征数据:最小值).
The graph compares the rate of smoking among men and women between the years 1960 and 2000.

分析
介绍数据时并不需要“地毯式覆盖”,只要确保不漏掉特征数据就可以了,否则银有可能陷入“越战”似的泥潭当中。
我们来看看范文是如何写女烟民人数变化这个主体段的(男烟民人数变化同理)。这个线图上方标题里的Per 1. 000 people 就是every 1, 000 people 的意思。
It is clear from the line graph that the rate of smoking among women was consistently lower than (持续低于) the rate for men, but the gap between them narrowed over the 40-year period (有时间变化是动态图,所以第1句比较整体趋势:女烟民的比例持续低于男烟民,但在这40年里之间的差距缩小). In 1960, the rate of smoking among women stood at (位于) only 80 in every 1, 000 women (特征点: 起点,而且突出了和男烟民起始人数多的比较). By 1972 (by +时间表示“ 截至这个时间") this figure had increased steadily (明显的变化趋势:持续上升) to320 per 1, 000 women. The rate of female smokers then remained stable at (接近水平线的一段是特征趋势:稳定..... around 320 per 1, 000 until 1984. The figure began to decline (明显的趋势: 下降) from 1984, reaching 200 per 1. 000 women by 2000 (特征点:终点).
范文:
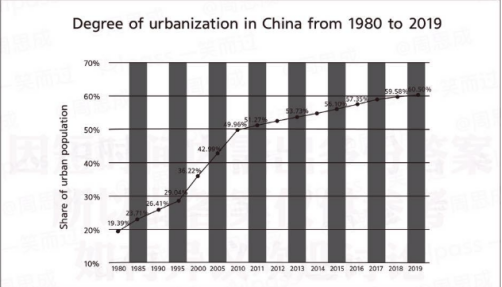
The bar chart supplies us with information concerning the degree of urbanization in China from 1980 to 2019. The data demonstrates that the share of urban population has been increasing year by year from 1980 to 2019. From 1995 to 2010, the share of urban population grew rapidly. In the nine years from 2010 to 2019, the urban population share grew slowly. What accounted for the slow growth of urbanization?
The possible reasons accounting for this phenomenon are listed as follows. First, the vast majority of urbanization has implemented a strict household registration system, which sets a high threshold for migrant workers to enter the city. Second, some cities have adopted a series of laws and policies to restrict the quality of migrant workers and keep most farmers out of the city. These reasons have led to a slowdown in urbanization.
To sum up, If China wants to speed up urbanization, its government can reform the household registration system, optimize the industrial structure and create more job opportunities. In this way, the urbanization process can be accelerated.
Considering all these, I believe that we should take a reasonable attitude toward higher education. In conclusion, from my point of view, such a phenomenon is positive and acceptable.