
A Brief Introduction of Traffic Engineering
Traffic engineering got its start with the popularization of internal combustion vehicles in the early 20th century, and has developed along with the progress of global motorization that began after World War II. Traffic engineering traditionally encompasses scientific and technical fields related to reduction of the negative aspects of automobiles, such as traffic congestion, traffic safety, and pollution (environmental load). This chapter introduces traffic flow sciences and provides an overview of related technologies.
1 Traffic flow fundamentals
The three variables, namely, traffic volume, density, and speed, are fundamental to understand automobile traffic flow on roads.
The term traffic flow rate [vehicles per hour (veh/h)]—or the term traffic volume in general— describes the number of vehicles passing through a given location per unit time based on the measurement conducted over a duration of 1 h or possibly less. Traffic flow is simply the number of automobiles passing through a given point, and thus is the traffic demand at the location when there is no traffic congestion. On the other hand, if there is traffic congestion, the traffic volume is equal to the traffic capacity of the downstream bottleneck (see Section 4.2) that causes the traffic congestion.
The term traffic density [veh/km] describes the number of vehicles present at a given time per unit space length based on measurement conducted over an interval of 1 km or possibly shorter. Unlike traffic volume, direct measurement of traffic density requires simultaneous aerial observation over relatively long stretches of road and is not very easy.
Traffic speed [km/h] is the representative speed of a traffic flow comprising various vehicles traveling at different speeds. This representative value must be the space mean speed of individual vehicles. It is calculated by dividing a given space length by the mean of travel times required for individual vehicles to travel the length. The space mean speed can be estimated by the harmonic mean of the speed of each vehicle observed at a given location. Using the space mean speed as the traffic speed, Eq. (1) holds.
(Traffic volume Q) = (Traffic density K) × (Traffic speed V) (1)
This equation does not generally hold when the simple arithmetic mean is used as the representative speed of traffic flow. Indeed, Eq. (1) corresponds to the law of conservation of mass in basic physics, which is universally holds for general flow phenomena, not only traffic flows.
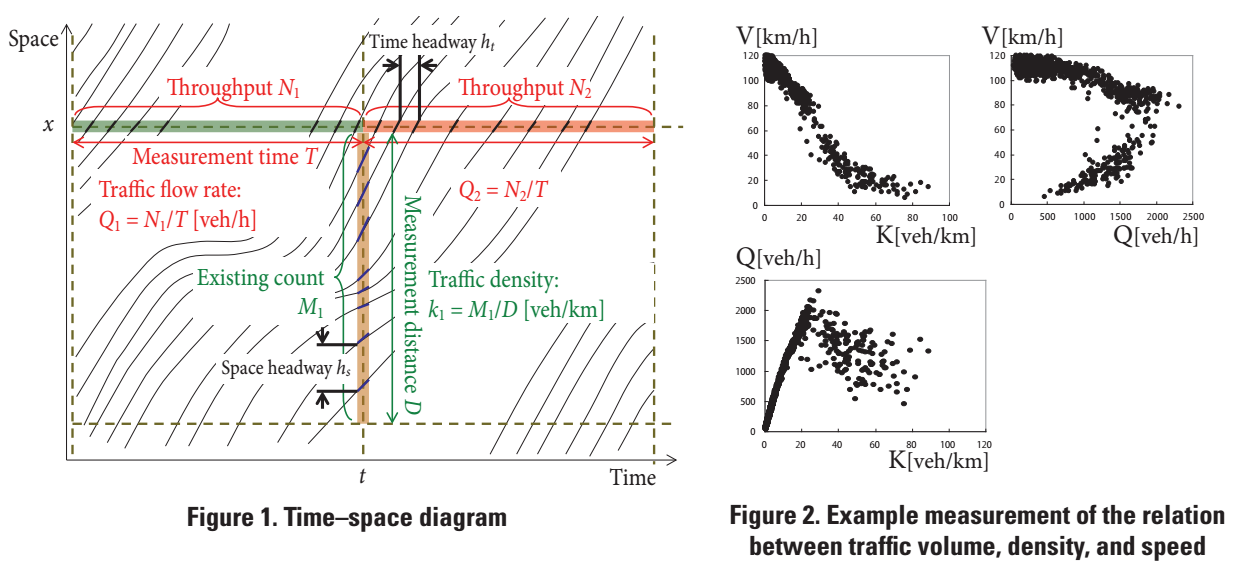
Figure 1 shows time–space trajectories of individual vehicles as well as the relation between traffic volume and density. As the figure shows, these two variables are in a symmetric relation on the time and space axes, with the reciprocal of the mean time headway corresponding to the traffic volume, and the reciprocal of the mean space headway corresponding to the traffic density.
Figure 2 shows the mutual relations among the three variables, using actual vehicle detector measurements aggregated in every 5 min and the calculated traffic density obtained by Eq. (1) using the measured traffic volume and speed. In general, the speed approaches a maximum value (the free speed) as traffic density approaches zero, and traffic density approaches a maximum value (the saturation density) as speed approaches zero. These two variables are in a monotonically decreasing relation. Furthermore, there exists a maximum traffic volume reached at a certain value of traffic density (the critical density) and a certain value of speed (the critical speed). Densities above the critical density and speeds below the critical speed indicate a state of traffic congestion; conversely, densities below the critical density and speeds above the critical speed indicate an uncongested traffic state.
Using the monotonic decreasing relationship between density and speed combined with Eq. (1), it is straightforward to show that the traffic volume–density (volume–speed) relationship is a binary function that has a maximum value of traffic volume. This is the theoretic basis for the existence of a maximum traffic volume (capacity) for road traffic.
2 Features of traffic congestion
2.1 Bottlenecks and the definition of traffic congestion
Traffic congestion is defined as a traffic state (a waiting queue) in which queued traffic (congested vehicles) develops upstream from a traffic capacity bottleneck that occurs when traffic demand exceeding the bottleneck traffic capacity attempts to enter the bottleneck. A bottleneck is a road section in which traffic capacity is relatively low in comparison with upstream and downstream road segments. Traffic congestion on inter-city expressways in Japan is generally triggered at sag sections (road sections with longitudinal slope changes from downward to upward) or at tunnel entrances.(1) On the other hand, major bottlenecks on European or American expressways are merging or diverging sections and weaving sections. Major bottlenecks on surface streets are key signalized intersections with heavy traffic, queues forming at parking garages of large shopping centers, and on-street parked cars. From the definition of traffic congestion, it is obvious that there is no fixed speed threshold to distinguish congested traffic conditions from uncongested traffic conditions. For simplicity, 40 km/h on inter-city expressways and 20 km/h on urban expressways are used as the thresholds to identify traffic congestion for practical use in Japan.
2.2 Calculating traffic congestion
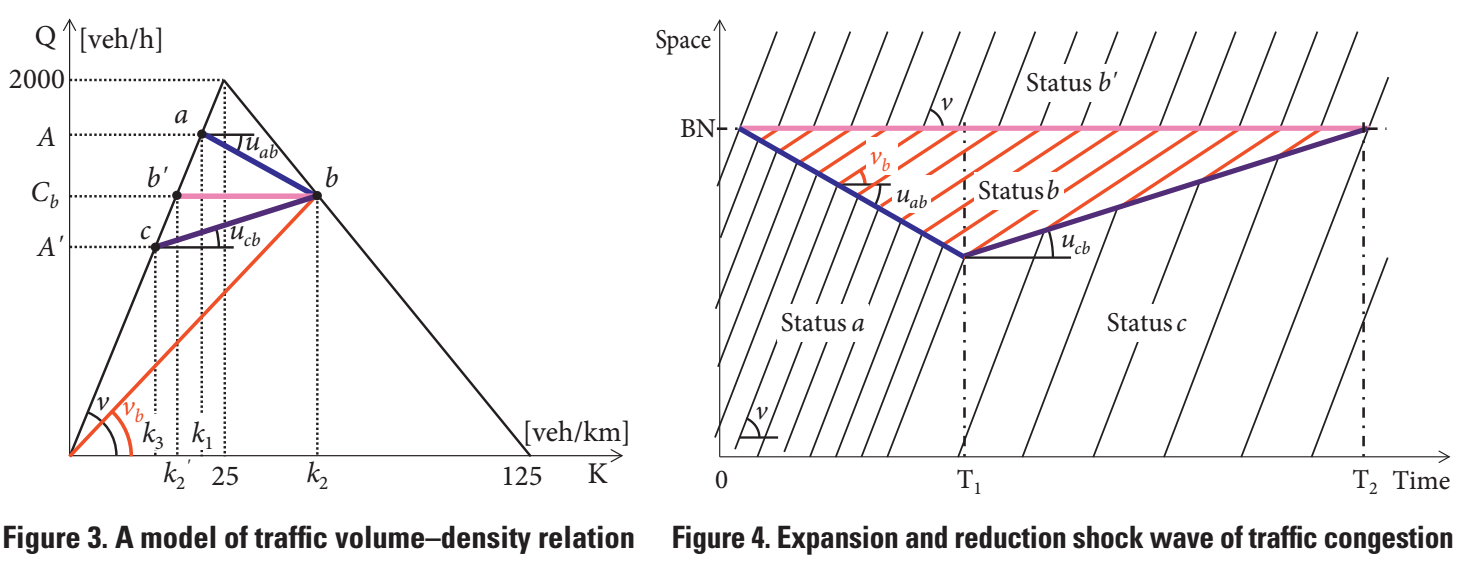 Figure 3 shows a simplified assumption of the volume–density relationship per lane based on the data shown in Fig. 2. Figure 4 schematically shows the change in traffic congestion caused by a bottleneck on a time–space diagram. Point a (traffic volume A, traffic density k1, velocity v) in Fig. 3 represents the traffic conditions of traffic demand A attempting to pass through a bottleneck with capacity Cb (location BN in Fig. 4). Here, in the case where A > Cb, traffic congestion occurs upstream of the bottleneck (point b in Fig. 3; traffic volume Cb, traffic density k2, velocity vb), and the tail of the congestion queue moves upstream. The shock wave speed uab is given by the following Eq. (2) according to shock wave theory:(2)
uab = ( A -Cb ) / ( k1- k2 ) (2)
The shock wave speed uab is the slope of the line connecting a and b in Fig. 3. The slope in Fig. 3 is obviously negative, which indicates that the shock wave moves upstream. The boundary between demand traffic condition a and traffic congestion b moves at speed uab in Fig. 4. If the traffic demand changes to point c in Fig. 3 (traffic volume A', traffic density k3, velocity v) and A' < Cb holds at time T1, then ucb is positive, meaning that the tail of the congestion queue shortens until it vanishes at time T2.
For example, when traffic demand A=1800 veh/h arrives at a bottleneck with capacity Cb=1600veh/h, the tail of traffic congestion moves upstream at a speed of uab = (1800-1600) / (22.5-50) ≈ –7 km/h, so if T1 = 2 h, the traffic congestion length L ≈ 14 km. If the traffic demand decreases to A' = 1500 veh/h at time T1, then ucb = (1500-1600) / (18.75-50) = 3.2 km/h and time T2 is T1 + L/ucb ≈ 6.5 h.
It is generally known that the excess of traffic demand over the bottleneck capacity is at most approximately 12–15% (in the case of this example, it is 12.5%, as given by 1800/1600 = 1.125) even when traffic congestion occurs due to an increase in traffic demand. It is also known that the duration of traffic congestion (6.5 h in this case) greatly exceeds the duration of traffic demand exceeding the capacity (2 h).(3)
2.3 Features of traffic congestion on ordinary expressway sections
It was recently found that on inter-city expressways in Japan, bottlenecks at sag and tunnel entrance sections together account for 80% of all bottleneck sections.4) There is no merging or traffic signals at such sections, but slight speed perturbations due to slight changes in slope cause speed reduction shock waves that propagate upstream, causing traffic congestion. The level of traffic demand causing such phenomena varies widely in the range of 75–90% of the normal capacity for ordinary expressway sections. This variation is thought to be due to the differences between individual drivers and between vehicle types in car-following behavior.(5)
Furthermore, once traffic becomes to traffic congestion, the bottleneck capacity declines further, to around 60% of the normal capacity for ordinary expressway sections. This is because drivers’ carfollowing behavior becomes sluggish due to driver boredom and fatigue caused by the low speed in traffic congestion.5) Assume traffic demand is 1800 veh/h per lane as shown in Fig. 3, and the reduced bottleneck capacity is 1600 veh/h per lane, which is equivalent to 80% of an ordinary expressway section’s normal capacity of 2000 veh/h per lane. The speed of extension of the traffic congestion tail is calculated to be approximately 7 km/h (see Section 4.2.2). If the reduced traffic capacity after formation of traffic congestion is 1200 veh/h per lane, which is equivalent to 60% of the normal capacity of an ordinary expressway section, the speed of extension of the traffic congestion tail doubles, to approximately 14 km/h based on Fig. 3 and Eq. (2). At a sag section, the traffic capacity is further lowered after formation of traffic congestion, and causes a rapid increase in the length of the traffic congestion queue. Furthermore, even when the traffic demand is reduced, the duration of traffic congestion is prolonged because the traffic congestion queue shortens at a lower speed. These are the reasons why congestion on expressways easily grows and persists.
3 Traffic performance-oriented planning and design of road networks
Expressways are the main arteries for high-volume, high-speed automobile transportation. They include long-distance nationwide expressways that form the backbone of the national transportation network, expressways that constitute major networks within regional areas, and urban expressways within large cities. For surface roads accepting more variety of transportation modes including pedestrians and cyclists, there are different functional classifications according to connectivity scale. Roads in cities furthermore perform various non-transportation functions, such as providing space for infrastructure like sewage and gas lines and performing disaster prevention functions to prevent the spread of fire. This makes such roads within cities (streets and avenues) quite different from inter-city roads (expressways and highways). In recent research activities in Japan, focus has been placed on such difference in transportation functions in hierarchical road classifications the concept of “performance-oriented” road planning and design has been promoted with the goal of attaining a road network that provides a certain level of traffic service functionality.(6)
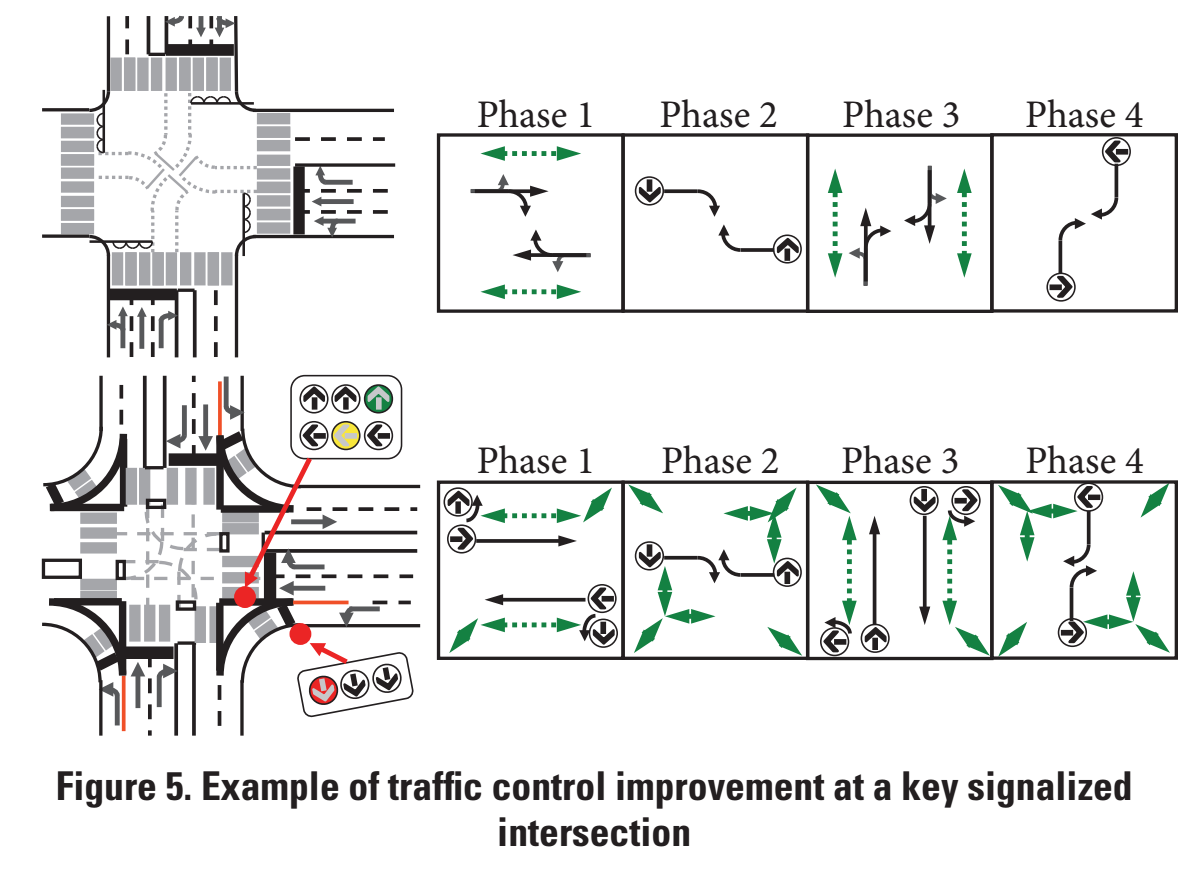
Junctions, the crossing points of roads, are key locations for transportation and are one of the most important elements for ensuring hierarchical road functionality. Many traffic capacity bottlenecks are at junctions, especially at key signalized at-grade intersections of surface streets. At intersections where traffic demand is concentrated, there are needs for proper geometric design (a sufficient number of lanes, grade separation, traffic islands, etc.) and for traffic signal phasing plan and optimization of signal control parameters (cycle, green split, and offset) to prevent the occurrence of traffic congestion (Fig. 5).
There are many intersections where the capacity (Cb) is high enough so that they are free from traffic congestion and capacity bottleneck. Even when the traffic demand D is extremely low (0 to D << Cb), waiting time (delay) occurs at signalized intersections corresponding to the signal control parameters. On the other hand, when traffic demand exceeds a certain volume (D > Q0) at an unsignalized intersection, the delay under unsignalized control may exceed that under signalized control. For intersections with moderate demand (0 <<D to Q0 < Cb), roundabouts have attracted attention in recent years in Japan as a method for both reducing delay and greatly reducing the risk of rear-end collisions and deai-gashira collisions (collisions that occur when vehicles, bicycles, pedestrians, etc. suddenly enter into an intersection) frequently observed at unsignalized intersections. There has been increasing momentum for the introduction of roundabouts in Japan.
To ensure a certain level of transportation functionality for arterial roads, it is important that traffic flow on arterial roads not be inhibited much at minor intersections. Effective means to that end include techniques concerning road geometric design and traffic operation and control, such as not connecting minor streets to arterial roads, limiting the allowance of traffic entering/exiting arterial roads by left turns only, and providing a dedicated auxiliary right turn lane (or pocket) at the median of arterial roads to separate this exiting right turn traffic from the main traffic stream on the road. The concepts described above are called “access management” in the United States7) which aims to establish a systematic scheme.
4 Road traffic management-based countermeasures
4.1 Fundamental ideas
The basic concepts of countermeasures for traffic congestion reduction or elimination are adjusting traffic demand and increasing bottleneck capacity. The former includes well-known traffic demand management (TDM), as well as additional efforts toward more dynamic adjustment methods in recent years such as providing traffic information and route guidance. The latter mainly includes physical measures such as increasing the number of lanes and expanding road networks, and additionally entails the introduction of active traffic management (ATM), which has been popular in Europe in recent years (see Section 4.2).
Improving traffic safety requires a more multifaceted approach that includes not only traffic engineering, but also vehicle technologies and the elucidation of human factors. Traffic congestion, particularly on expressways, is a significant cause of rear-end and near collisions of vehicles, and therefore, traffic congestion alleviation measures may also significantly reduce such accidents.8) It is important to let drivers naturally understand the road geometric structure and conditions by applying proper road alignment, arrangement planning of intersections, and so forth. Appropriate setting of overall traffic restrictions, including signal control planning, may also result in highly safe spaces for expressways, as well as for surface streets which are shared with pedestrians and cyclists.
Environmental impacts due to road vehicular traffic include noise, air pollution, and greenhouse gas emissions. Improvements in automobile performance and fuel quality have resulted in significant lessening of noise and air pollution problems in Japan in recent years, and improved fuel economy has reduced carbon dioxide emissions. Nonetheless, traffic congestion and repeated stopping and starting caused by traffic signals would lead to needless carbon dioxide emissions,9) and therefore any traffic smoothing policies to alleviate traffic congestion or to reduce number of stops are effective at reducing the environmental impact of road vehicular traffic.
4.2 Expressway traffic measures
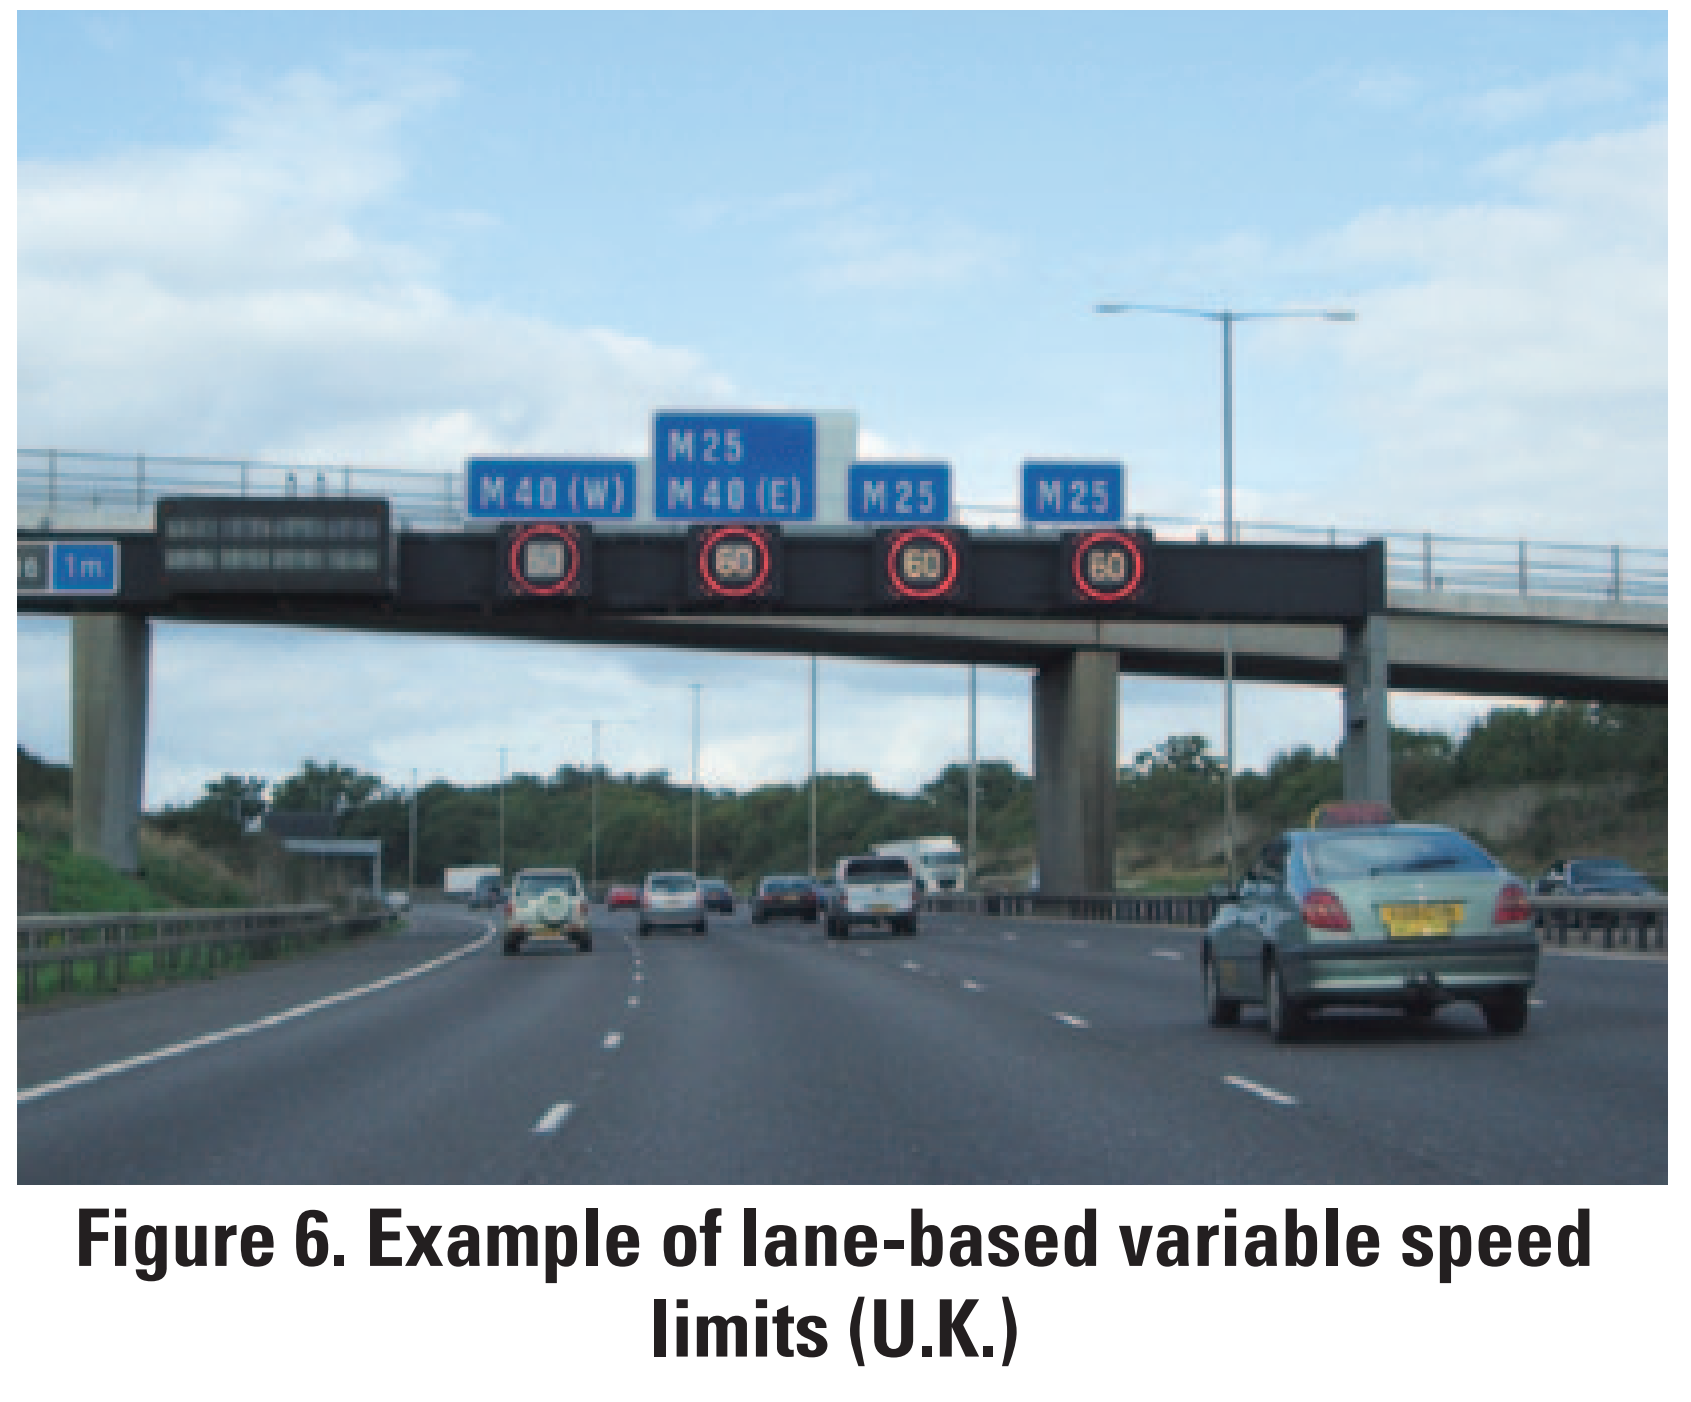
Expressways are motorways (dedicated roads for automobiles) that serve as the main arteries for highvolume, high-speed nationwide and urban transportation. Frequent traffic congestion on expressways is a functional failure of these arteries, and leads to major losses to the country and to regional communities. Reducing congestion, especially on expressways, is thus extremely important. Ramp metering, which controls traffic volume at on-ramps, has become a common measure, and ATM such as lanebased variable speed limits (Fig. 6) and temporary hard shoulder opening has also been popular in developed countries except Japan.
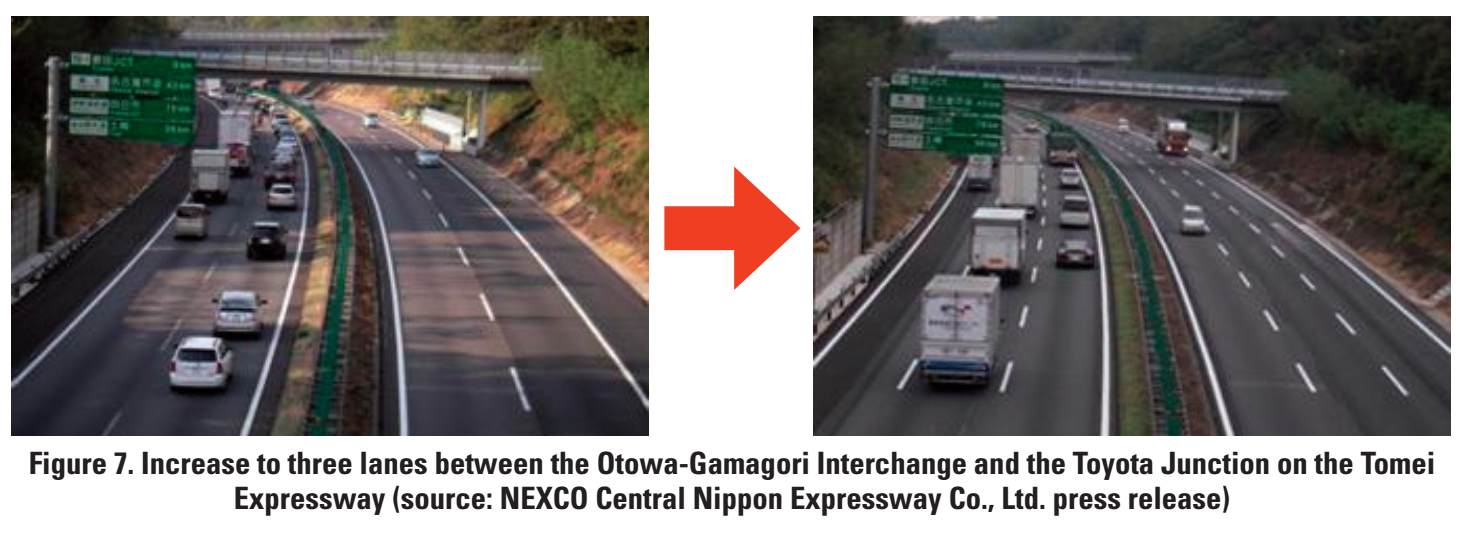
Particularly severe traffic congestion was expected to be caused by partial opening of the Shizuoka segment of the New Tomei Expressway due to traffic concentration on the Tomei Expressway section between the Otowa-Gamagori Interchange and Toyota Junction prior to opening the Aichi segment. Therefore, a policy was implemented that increased the number of traffic lanes on the Tomei Expressway by narrowing them as shown in Fig. 7, while keeping road width unchanged.(10) This measure in Japan resulted in a great reduction of traffic congestion and traffic accidents on the Tomei Expressway section. An advanced automotive technology that has recently been attracting attention is adaptive cruise control (an advanced form of cruise control, which automatically maintains a constant speed). Adaptive cruise control adjusts the vehicle’s speed and spacing ahead to conform to the leading vehicle’s behavior. Because drivers’ car-following behavior is a prime cause of bottlenecks on ordinary expressway sections (see Section 2.3), adaptive cruise control technology is expected to help reduce traffic congestion.(11)
5 Future trends in traffic management
One issue in traffic engineering is the extreme difficulty of running laboratory experiments. This makes careful practical observations and investigations in the field important. Small differences and changes in traffic flow, such as 10–20% variations in traffic demand and the emergence of traffic congestion at sag sections due to individual differences in driver behavior, can have a significant impact on the characteristics of traffic flow: whether it is congested or uncongested. The conventional point observations with vehicle detectors described in Section 1 have limitations to describe such temporal and spatial variations.
Advanced information technology has enabled the establishment of “probe” technology that allows temporally and spatially continuous measurement and monitoring of traffic status via automobile mounted navigation systems or drivers’ smartphones. Complete knowledge of the overall quantitative features of traffic flow, however, remains difficult because such techniques provide only sampled data.
An estimation method of the overall traffic state in combination with data from vehicle detectors and probe data has recently been developed by applying the traffic flow theory described in Section 2) It is expected that the accumulation of large amounts of detector and probe data and the application of recent data mining technologies will provide dramatic increases in our knowledge of overall traffic states. Based on knowledge derived from such accumulated data, real-time use of sensor and probe data will allow the establishment of “nowcast” technology13) to estimate the current traffic state through the application of theory-based traffic simulation models. The dynamic flexible application of nowcast technology applied to traffic information provision, route guidance systems, and ramp metering and TDM measures should result in minimization of daily recurrent traffic congestion. The nowcast technology is also considered to allow for prompt planning and execution of countermeasures against bad weather, large events, traffic accidents, and other incidents that are difficult to predict.
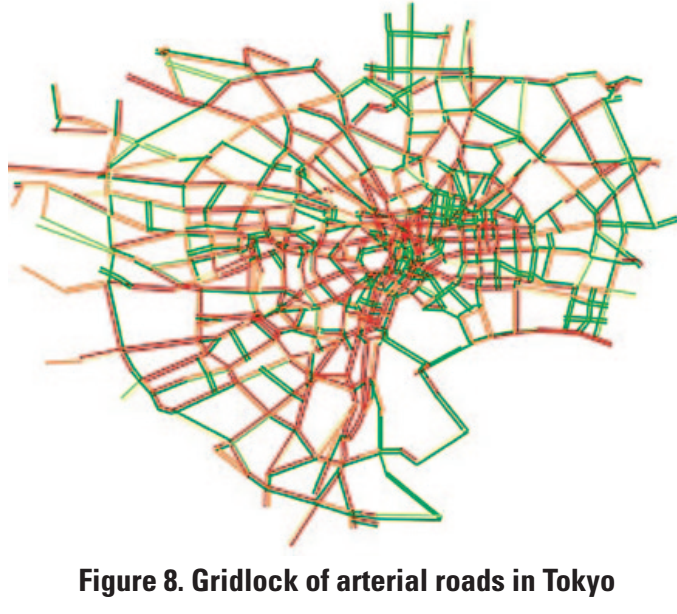
For example, Fig. 8 shows the state of extraordinarily massive traffic congestion that occurred on major arterial roads in the Tokyo Metropolitan Area immediately after the Great East Japan Earthquake on March 11, 2011.14) Gridlock, which is the phenomenon where an entire road traffic network becomes paralyzed, emerged on that day. Gridlock can be defined as the traffic state where the throughput of a bottleneck is reduced to a value lower than the original bottleneck capacity by the tail of a traffic congestion formed upstream of the bottleneck extending to the bottleneck location on a loop-shaped road network. Gridlock is a serious traffic congestion phenomenon that is extremely difficult to resolve once it starts. It is believed that the development of a system for real-time detection of gridlock, or the establishment of traffic control methods for predicting and avoiding it, would be a significant contribution leading to increased stability and reliability of road transportation systems.
References
1) Koshi, M. 1985. “Traffic Flow Phenomena in Expressway Tunnels.” IATSS Research Vol. 9: 50–56.
2) Lighthill, M. J., G. B. Whitham. 1955. “On Kinematic Waves: 2. A Theory of Traffic Flow on Long Crowded Roads.” Proceedings of the Royal Society of London A Vol. 229: 317–345.
3) Koshi, M., H. Akahane, and M. Kuwahara. 1989. “Explanation of and Countermeasures against Traffic Congestion.” IATSS Research Vol. 13, No. 2: 53–63.
4) http://www.mlit.go.jp/road/ir/ir-council/autopilot/pdf/05/6.pdf.
5) Koshi, M., M. Kuwahara, and H. Akahane. 1992. “Capacity of Sags and Tunnels on Japanese Motorways.” ITE Journal Vol. 62, No. 5: 17–22.
6) Oguchi, T. 2008. “Redesign of Transport Systems on Highways, Streets and Avenues.” IATSS Research Vol. 32, No. 1: 6–13.
7) Transportation Research Board. 2003. Access Management Manual.
8) Oguchi T., H. Akahane and Y. Yamada. 2004. “Analysis of Accident Rate in Critical Condition of Traffic Flow on Expressways.” Traffic Engineering Vol.39, No.3: 41-46. (in Japanese)
9) Oguchi T. and M. Katakura. 2000. “New Conceptual Evaluation Method of Amount of Exhaust Emission Gas on Vehicular Road Traffic.” Advances in Transport (Urban Transport VI) Vol.6: 383-392.
10) http://media2.cnexco.co.jp/images/press_conference/78/2918114934ea7888494e01.pdf
11) Kanazawa, F., K. Suzuki, K. Sakai, and K. Iwatate. 2013. “Conducting the FOT to Evaluate the Driving Practice for Smooth Traffic to Mitigate Traffic Congestion at Sag Sections on Expressways. ” In Proceedings of 20th World Congress on ITS. CD-ROM.
12) Mehran, B., M. Kuwahara, and F. Naznin. 2012. “Implementing Kinematic Wave Theory to Reconstruct Vehicle Trajectories from Fixed and Probe Sensor Data.” Transportation Research Part C Vol. 20: 144–163.
13) Hanabusa, H., M. Kobayashi, K. Koide, R. Horiguchi, and T. Oguchi. 2013. “Development of the Nowcast Traffic Simulation System for Road Traffic in Urban Area.” In Proceedings of 20th World Congress on ITS. CD-ROM.
14) Oguchi, T., M. Ito, R. Mizuta, R. Horiguchi and M. Iijima. 2013. “Analysis with Traffic Simulation and Evaluation of Traffic Congestion Mitigation Measures for the Tokyo 23-wards at a Great Earthquake Disaster. ” Proceedings of Traffic Engineering Meeting, Vol. 33: 273-278. (in Japanese)
From:Takashi Oguchi
Professor, Institute of Industrial Science, The University of Tokyo
|
Chapter 4 Traffic engineering Takashi Oguchi Professor, Institute of Industrial Science, The University of Tokyo |
Trafficengineeringgotitsstartwiththepopularizationofinternalcombustionvehiclesintheearly20th century,andhasdevelopedalongwiththeprogressofglobalmotorizationthatbeganafterWorldWar
II.Trafficengineeringtraditionallyencompassesscientificandtechnicalfieldsrelatedtoreductionofthenegativeaspectsofautomobiles,suchastrafficcongestion,trafficsafety,andpollution(environmental load).Thischapterintroducestrafficflowsciencesandprovidesanoverviewofrelatedtechnologies.
4.1Traffic flow fundamentals
Thethreevariables,namely,trafficvolume,density,andspeed,arefundamentaltounderstandautomobile traffic flow onroads.
Thetermtrafficflowrate[vehiclesperhour(veh/h)]—orthetermtrafficvolumeingeneral— describesthenumberofvehiclespassingthroughagivenlocationperunittimebasedonthemeasurementconductedoveradurationof1horpossiblyless.Trafficflowissimplythenumberofautomobilespassingthroughagivenpoint,andthusisthetrafficdemandatthelocationwhenthereisnotrafficcongestion.Ontheotherhand,ifthereistrafficcongestion,thetrafficvolumeisequaltothetrafficcapacity ofthedownstreambottleneck(seeSection4.2)thatcausesthetrafficcongestion.
Thetermtrafficdensity[veh/km]describesthenumberofvehiclespresentatagiventimeperunitspacelengthbasedonmeasurementconductedoveranintervalof1kmorpossiblyshorter.Unliketrafficvolume,directmeasurementoftrafficdensityrequiressimultaneousaerialobservationoverrelatively longstretchesofroadandisnotveryeasy.
Trafficspeed[km/h]istherepresentativespeedofatrafficflowcomprisingvariousvehiclestravelingatdifferentspeeds.Thisrepresentativevaluemustbethespacemeanspeedofindividualvehicles.It iscalculatedbydividingagivenspacelengthbythemeanoftraveltimesrequiredforindividualvehicles totravelthelength.Thespacemeanspeedcanbeestimatedbytheharmonicmeanofthespeedofeach vehicleobservedatagivenlocation.Usingthespacemeanspeedasthetrafficspeed,Eq.(1)holds.
(TrafficvolumeQ)=(TrafficdensityK)×(TrafficspeedV) (1)
| Throughput N1 |
Space V[km/h] V[km/h]
![]() 120
120
100
80
x 60
40
![]() 20
20
0
0 20
| K |
40 60 80100
120
100
80
60
40
20
0
![]()
0 500 1000 1500 20002500
Q[veh/h]
![]() 2500
2500
2000
1500
1000
[veh/km]
Q[veh/h]
500
t Time
0
| K |
0 20 40 60 80 100 120
[veh/km]
Figure1.Time–spacediagram Figure2.Examplemeasurementoftherelation betweentrafficvolume,density,andspeed
Thisequationdoesnotgenerallyholdwhenthesimplearithmeticmeanisusedastherepresentative speedoftrafficflow.Indeed,Eq.(1)correspondstothelawofconservationofmassinbasicphysics, whichisuniversallyholdsforgeneralflowphenomena,notonlytrafficflows.
Figure1showstime–spacetrajectoriesofindividualvehiclesaswellastherelationbetweentraffic volumeanddensity.Asthefigureshows,thesetwovariablesareinasymmetricrelationonthetimeand spaceaxes,withthereciprocalofthemeantimeheadwaycorrespondingtothetrafficvolume,andthe reciprocalofthemeanspaceheadwaycorrespondingtothetrafficdensity.
Figure2showsthemutualrelationsamongthethreevariables,usingactualvehicledetectormeasurementsaggregatedinevery5minandthecalculatedtrafficdensityobtainedbyEq.(1)usingthe measuredtrafficvolumeandspeed.Ingeneral,thespeedapproachesamaximumvalue(thefreespeed) astrafficdensityapproacheszero,andtrafficdensityapproachesamaximumvalue(thesaturationdensity)asspeedapproacheszero.Thesetwovariablesareinamonotonicallydecreasingrelation.Furthermore,thereexistsamaximumtrafficvolumereachedatacertainvalueoftrafficdensity(thecriticaldensity)andacertainvalueofspeed(thecriticalspeed).Densitiesabovethecriticaldensityandspeeds belowthecriticalspeedindicateastateoftrafficcongestion;conversely,densitiesbelowthecriticaldensityandspeedsabovethecriticalspeedindicateanuncongestedtrafficstate.
UsingthemonotonicdecreasingrelationshipbetweendensityandspeedcombinedwithEq.(1),itisstraightforwardtoshowthatthetrafficvolume–density(volume–speed)relationshipisabinaryfunctionthathasamaximumvalueoftrafficvolume.Thisisthetheoreticbasisfortheexistenceofamaximum traffic volume (capacity) for roadtraffic.
4.2Features of traffic congestion
4.2.1 Bottlenecksandthedefinitionoftrafficcongestion
Traffic congestion isdefined as a traffic state (a waitingqueue) in which queued traffic (congestedvehicles)
developsupstreamfromatrafficcapacitybottleneckthatoccurswhentrafficdemandexceedingthebottlenecktrafficcapacityattemptstoenterthebottleneck.Abottleneckisaroadsectioninwhichtraffic capacityisrelativelylowincomparisonwithupstreamanddownstreamroadsegments.Trafficcongestiononinter-cityexpresswaysinJapanisgenerallytriggeredatsagsections(roadsectionswithlongitudinalslopechangesfromdownwardtoupward)orattunnelentrances.1)Ontheotherhand,majorbottlenecksonEuropeanorAmericanexpresswaysaremergingordivergingsectionsandweavingsections. Majorbottlenecksonsurfacestreetsarekeysignalizedintersectionswithheavytraffic,queuesforming atparkinggaragesoflargeshoppingcenters,andon-streetparkedcars.Fromthedefinitionoftraffic congestion,itisobviousthatthereisnofixedspeedthresholdtodistinguishcongestedtrafficconditions fromuncongestedtrafficconditions.Forsimplicity,40km/honinter-cityexpresswaysand20km/honurbanexpresswaysareusedasthethresholdstoidentifytrafficcongestionforpracticaluseinJapan.
4.2.2 Calculating trafficcongestion
Figure3showsasimplifiedassumptionofthevolume–densityrelationshipperlanebasedonthedatashowninFig.2.Figure4schematicallyshowsthechangeintrafficcongestioncausedbyabottleneckon atime–spacediagram.Pointa(trafficvolumeA,trafficdensityk1,velocityv)inFig.3representsthe trafficconditionsoftrafficdemandAattemptingtopassthroughabottleneckwithcapacityCb(location BNinFig.4).Here,inthecasewhereA>Cb,trafficcongestionoccursupstreamofthebottleneck(point binFig.3;trafficvolumeCb,trafficdensityk2,velocityvb),andthetailofthecongestionqueuemoves upstream.TheshockwavespeeduabisgivenbythefollowingEq.(2)accordingtoshockwavetheory:2)
uab=(A−Cb)/(k1−k2) (2)
TheshockwavespeeduabistheslopeofthelineconnectingaandbinFig.3.TheslopeinFig.3isobviouslynegative,whichindicatesthattheshockwavemovesupstream.Theboundarybetween demandtrafficconditionaandtrafficcongestionbmovesatspeeduabinFig.4.Ifthetrafficdemand changestopointcinFig.3(trafficvolumeA',trafficdensityk3,velocityv)andA'<CbholdsattimeT1,thenucbispositive,meaningthatthetailofthecongestionqueueshortensuntilitvanishesattimeT2.
For example, when traffic demand A=1800 veh/h arrives at a bottleneckwith capacity Cb=1600
| [veh/h] |
Q 2000
A C
Space
| v |
BN
b
A'
k2' 25 k2
125 K 0 T1
T2 Time
Figure3.Amodeloftrafficvolume–densityrelation Figure4.Expansionandreductionshockwaveoftrafficcongestion
veh/h,thetailoftrafficcongestionmovesupstreamataspeedofuab=(1800−1600)/(22.5−50)≈–7 km/h,soifT1=2h,thetrafficcongestionlengthL≈14km.IfthetrafficdemanddecreasestoA'=1500 veh/hattimeT1,thenucb=(1500−1600)/(18.75−50)=3.2km/handtimeT2isT1+L/ucb≈6.5h.
Itisgenerallyknownthattheexcessoftrafficdemandoverthebottleneckcapacityisatmost approximately12–15%(inthecaseofthisexample,itis12.5%,asgivenby1800/1600=1.125)even whentrafficcongestionoccursduetoanincreaseintrafficdemand.Itisalsoknownthatthedurationof trafficcongestion(6.5hinthiscase)greatlyexceedsthedurationoftrafficdemandexceedingthecapacity (2h).3)
4.2.3 Featuresoftrafficcongestiononordinaryexpresswaysections
Itwasrecentlyfoundthatoninter-cityexpresswaysinJapan,bottlenecksatsagandtunnelentrancesectionstogetheraccountfor80%ofallbottlenecksections.4)Thereisnomergingortrafficsignalsatsuch sections,butslightspeedperturbationsduetoslightchangesinslopecausespeedreductionshockwaves thatpropagateupstream,causingtrafficcongestion.Theleveloftrafficdemandcausingsuchphenomenavarieswidelyintherangeof75–90%ofthenormalcapacityforordinaryexpresswaysections.This variationisthoughttobeduetothedifferencesbetweenindividualdriversandbetweenvehicletypesin car-followingbehavior.5)
Furthermore,oncetrafficbecomestotrafficcongestion,thebottleneckcapacitydeclinesfurther,to around60%ofthenormalcapacityforordinaryexpresswaysections.Thisisbecausedrivers’carfollowingbehaviorbecomessluggishduetodriverboredomandfatiguecausedbythelowspeedintrafficcongestion.5)Assumetrafficdemandis1800veh/hperlaneasshowninFig.3,andthereducedbottleneckcapacityis1600veh/hperlane,whichisequivalentto80%ofanordinaryexpresswaysection’s normalcapacityof2000veh/hperlane.Thespeedofextensionofthetrafficcongestiontailiscalculated tobeapproximately7km/h(seeSection4.2.2).Ifthereducedtrafficcapacityafterformationoftrafficcongestionis1200veh/hperlane,whichisequivalentto60%ofthenormalcapacityofanordinaryexpresswaysection,thespeedofextensionofthetrafficcongestiontaildoubles,toapproximately14 km/hbasedonFig.3andEq.(2).Atasagsection,thetrafficcapacityisfurtherloweredafterformation oftrafficcongestion,andcausesarapidincreaseinthelengthofthetrafficcongestionqueue.Furthermore,evenwhenthetrafficdemandisreduced,thedurationoftrafficcongestionisprolongedbecause thetrafficcongestionqueueshortensatalowerspeed.Thesearethereasonswhycongestiononexpresswayseasily grows andpersists.
4.3Traffic performance-oriented planning and design of road networks
Expresswaysarethemainarteriesforhigh-volume,high-speedautomobiletransportation.Theyinclude long-distance nationwide expressways that form the backbone ofthe national transportation network, expresswaysthatconstitutemajornetworkswithinregionalareas,andurbanexpresswayswithinlarge cities. For surface roads accepting more variety of transportation modes including pedestriansand
cyclists,therearedifferentfunctionalclassificationsaccordingtoconnectivityscale.Roadsincitiesfurthermoreperformvariousnon-transportationfunctions,suchasprovidingspaceforinfrastructurelike sewageandgaslinesandperformingdisasterpreventionfunctionstopreventthespreadoffire.This makessuchroadswithincities(streetsandavenues)quitedifferentfrominter-cityroads(expresswaysandhighways).InrecentresearchactivitiesinJapan,focushasbeenplacedonsuchdifferenceintransportationfunctionsinhierarchicalroadclassificationstheconceptof“performance-oriented”roadplanninganddesignhasbeenpromotedwiththegoalofattainingaroadnetworkthatprovidesacertain level of traffic servicefunctionality.6)
Phase1 Phase2 Phase3 Phase4
|
|
|
|
![]() Phase1 Phase2 Phase3 Phase4
Phase1 Phase2 Phase3 Phase4
Figure 5. Example of traffic controlimprovement at a key signalized intersection
Junctions, the crossing points of roads, are key locations for transportation and are oneof the most important elements for ensuring hierarchical road functionality. Manytrafficcapacitybottlenecksare atjunctions,especiallyatkeysignalizedat-gradeintersectionsofsurface streets.Atintersectionswheretraffic demandis concentrated, there are needsforpropergeometricdesign (asufficientnumberoflanes,grade separation,trafficislands,etc.)and fortraffic signal phasing planand
optimization of signal control parameters(cycle, green split, and offset) to prevent the occurrence of
traffic congestion(Fig. 5).
Therearemanyintersectionswherethecapacity(Cb)ishighenoughsothattheyarefreefromtrafficcongestionandcapacitybottleneck.EvenwhenthetrafficdemandDisextremelylow(0toD≪Cb), waitingtime (delay) occurs at signalized intersections corresponding to the signalcontrol parameters. Ontheotherhand,whentrafficdemandexceedsacertainvolume(D>Q0)atanunsignalizedintersection, the delay underunsignalized control may exceed that under signalized control. Forintersections withmoderatedemand(0≪DtoQ0<Cb),roundaboutshaveattractedattentioninrecentyearsinJapanasamethodforbothreducingdelayandgreatlyreducingtheriskofrear-endcollisionsanddeai-gashiracollisions(collisionsthatoccurwhenvehicles,bicycles,pedestrians,etc.suddenlyenterintoanintersection)frequently observed at unsignalizedintersections. There has been increasingmomentum for the introduction of roundabouts inJapan.
Toensureacertainleveloftransportationfunctionalityforarterialroads,itisimportantthattrafficflowonarterialroadsnotbeinhibitedmuchatminorintersections.Effectivemeanstothatendinclude techniquesconcerningroadgeometricdesignandtrafficoperationandcontrol,suchasnotconnecting minorstreetstoarterialroads,limitingtheallowanceoftrafficentering/exitingarterialroadsbyleft turnsonly,andprovidingadedicatedauxiliaryrightturnlane(orpocket)atthemedianofarterialroads
toseparatethisexitingrightturntrafficfromthemaintrafficstreamontheroad.Theconceptsdescribed abovearecalled“accessmanagement”intheUnitedStates7) whichaimstoestablishasystematic scheme.
4.4Road traffic management-basedcountermeasures
4.4.1 Fundamentalideas
Thebasicconceptsofcountermeasuresfortrafficcongestionreductionoreliminationareadjustingtrafficdemandandincreasingbottleneckcapacity.Theformerincludeswell-knowntrafficdemandmanagement(TDM),aswellasadditionaleffortstowardmoredynamicadjustmentmethodsinrecentyears suchasprovidingtrafficinformationandrouteguidance.Thelattermainlyincludesphysicalmeasures suchasincreasingthenumberoflanesandexpandingroadnetworks,andadditionallyentailstheintroductionofactivetrafficmanagement(ATM),whichhasbeenpopularinEuropeinrecentyears(seeSection4.4.2).
Improvingtrafficsafetyrequiresamoremultifacetedapproachthatincludesnotonlytrafficengineering,butalsovehicletechnologiesandtheelucidationofhumanfactors.Trafficcongestion,particularlyonexpressways,isasignificantcauseofrear-endandnearcollisionsofvehicles,andtherefore,trafficcongestionalleviationmeasuresmayalsosignificantlyreducesuchaccidents.8)Itisimportanttolet driversnaturallyunderstandtheroadgeometricstructureandconditionsbyapplyingproperroadalignment,arrangementplanningofintersections,andsoforth.Appropriatesettingofoveralltrafficrestrictions,includingsignalcontrolplanning,mayalsoresultinhighlysafespacesforexpressways,aswellas forsurfacestreetswhicharesharedwithpedestriansandcyclists.
Environmental impacts due to roadvehicular traffic include noise, air pollution, and greenhouse gas emissions.Improvements in automobile performance andfuel quality have resulted insignificant lesseningofnoiseandairpollutionproblemsinJapaninrecentyears,andimprovedfueleconomyhas reduced carbon dioxide emissions. Nonetheless,traffic congestion and repeated stopping and starting causedbytrafficsignalswouldleadtoneedlesscarbondioxideemissions,9) andthereforeanytraffic smoothingpoliciestoalleviatetrafficcongestionortoreducenumberofstopsareeffectiveatreducingtheenvironmentalimpactofroadvehiculartraffic.
4.4.2 Expressway trafficmeasures
Expresswaysaremotorways(dedicatedroadsforautomobiles)thatserveasthemainarteriesforhighvolume,high-speednationwideandurbantransportation.Frequenttrafficcongestiononexpresswaysis afunctionalfailureofthesearteries,andleadstomajorlossestothecountryandtoregionalcommunities.Reducingcongestion,especiallyonexpressways,isthusextremelyimportant.Rampmetering,whichcontrolstrafficvolumeaton-ramps,hasbecomeacommonmeasure,andATMsuchaslanebasedvariablespeedlimits(Fig.6)andtemporaryhardshoulderopeninghasalsobeenpopularin developedcountries exceptJapan.
Particularlyseveretrafficcongestionwasexpected tobecausedbypartialopeningoftheShizuokasegmentoftheNewTomeiExpresswayduetotrafficconcentration on the TomeiExpressway section between the Otowa-Gamagori Interchange and Toyota Junction priortoopeningtheAichisegment.Therefore,apolicy wasimplemented that increased the number oftraffic lanesontheTomeiExpresswaybynarrowingthemas showninFig.7,whilekeepingroadwidthunchanged.10) ThismeasureinJapanresultedinagreatreductionof trafficcongestionandtrafficaccidentsontheTomei
![]()
Figure 6. Example of lane-based variablespeed limits (U.K.)
Expresswaysection.Anadvancedautomotivetechnologythathasrecentlybeenattractingattentionisadaptive cruise control (an advanced form of cruise control, whichautomatically maintains a constant speed).Adaptivecruisecontroladjuststhevehicle’sspeedandspacingaheadtoconformtotheleading vehicle’sbehavior.Becausedrivers’car-followingbehaviorisaprimecauseofbottlenecksonordinaryexpressway sections (see Section 4.2.3),adaptive cruise control technology is expected to help reduce trafficcongestion.11)
![]()
![]()
Figure7.IncreasetothreelanesbetweentheOtowa-GamagoriInterchangeandtheToyotaJunctionontheTomei Expressway(source:NEXCOCentralNipponExpresswayCo.,Ltd.pressrelease)
4.5Future trends in traffic management
Oneissueintrafficengineeringistheextremedifficultyofrunninglaboratoryexperiments.Thismakescarefulpracticalobservationsandinvestigationsinthefieldimportant.Smalldifferencesandchangesin trafficflow,suchas10–20%variationsintrafficdemandandtheemergenceoftrafficcongestionatsag sectionsduetoindividualdifferencesindriverbehavior,canhaveasignificantimpactonthecharacteristicsoftrafficflow:whetheritiscongestedoruncongested.Theconventionalpointobservationswith vehicledetectorsdescribedinSection4.1havelimitationstodescribesuchtemporalandspatialvariations.
Advanced information technology has enabledthe establishment of “probe” technology that allows
temporally and spatiallycontinuous measurement and monitoring of traffic status via automobilemountednavigationsystemsordrivers’smartphones.Completeknowledgeoftheoverallquantitative featuresoftrafficflow,however,remainsdifficultbecausesuchtechniquesprovideonlysampleddata.
![]() Anestimationmethodoftheoveralltrafficstateincombinationwithdatafromvehicledetectors andprobedatahasrecentlybeendevelopedbyapplyingthetrafficflowtheorydescribedinSection 4.2.12)Itisexpectedthattheaccumulationoflargeamountsofdetectorandprobedataandtheapplicationofrecentdataminingtechnologieswillprovidedramaticincreasesinourknowledgeofoveralltrafficstates.Basedonknowledgederivedfromsuchaccumulateddata,real-timeuseofsensorandprobedatawillallowtheestablishmentof“nowcast”technology13)toestimatethecurrenttrafficstatethrough theapplicationoftheory-basedtrafficsimulationmodels.Thedynamicflexibleapplicationofnowcast technologyapplied to traffic information provision,route guidance systems, and ramp metering and TDMmeasuresshouldresultinminimizationofdailyrecurrenttrafficcongestion.Thenowcasttechnologyisalsoconsideredtoallowforpromptplanningandexecutionofcountermeasuresagainstbad weather,largeevents,trafficaccidents,andotherincidentsthataredifficulttopredict.
Anestimationmethodoftheoveralltrafficstateincombinationwithdatafromvehicledetectors andprobedatahasrecentlybeendevelopedbyapplyingthetrafficflowtheorydescribedinSection 4.2.12)Itisexpectedthattheaccumulationoflargeamountsofdetectorandprobedataandtheapplicationofrecentdataminingtechnologieswillprovidedramaticincreasesinourknowledgeofoveralltrafficstates.Basedonknowledgederivedfromsuchaccumulateddata,real-timeuseofsensorandprobedatawillallowtheestablishmentof“nowcast”technology13)toestimatethecurrenttrafficstatethrough theapplicationoftheory-basedtrafficsimulationmodels.Thedynamicflexibleapplicationofnowcast technologyapplied to traffic information provision,route guidance systems, and ramp metering and TDMmeasuresshouldresultinminimizationofdailyrecurrenttrafficcongestion.Thenowcasttechnologyisalsoconsideredtoallowforpromptplanningandexecutionofcountermeasuresagainstbad weather,largeevents,trafficaccidents,andotherincidentsthataredifficulttopredict.
Forexample,Fig.8showsthestateofextraordinarilymassivetrafficcongestionthatoccurredon majorarterialroadsintheTokyoMetropolitanArea immediatelyafter the Great East Japan Earthquake onMarch11,2011.14)Gridlock,whichisthephenomenonwhereanentireroadtrafficnetworkbecomesparalyzed,emergedonthatday.Gridlockcanbe definedasthetrafficstatewherethethroughputofabottleneckisreducedtoavaluelowerthantheoriginalbottleneckcapacitybythetailofatrafficconges-
tion formed upstream of thebottleneck extendingto
thebottlenecklocationonaloop-shapedroadnet-
Figure 8. Gridlock of arterial roads in Tokyo
work.Gridlockisaserioustrafficcongestionphenomenonthatisextremelydifficulttoresolveonceit starts.Itisbelievedthatthedevelopmentofasystemforreal-timedetectionofgridlock,ortheestablishmentoftrafficcontrolmethodsforpredictingandavoidingit,wouldbeasignificantcontribution leadingtoincreasedstabilityandreliabilityofroadtransportationsystems.
References
1) Koshi,M.1985.“TrafficFlowPhenomenainExpresswayTunnels.”IATSSResearchVol.9:50–56.
2) Lighthill,M.J.,G.B.Whitham.1955.“OnKinematicWaves:2.ATheoryofTrafficFlowonLongCrowdedRoads.”ProceedingsoftheRoyalSocietyofLondonAVol.229:317–345.
3) Koshi,M.,H.Akahane,andM.Kuwahara.1989.“ExplanationofandCountermeasuresagainstTrafficCongestion.”IATSS Research Vol.13, No. 2:53–63.
4) http://www.mlit.go.jp/road/ir/ir-council/autopilot/pdf/05/6.pdf.
5) Koshi,M.,M.Kuwahara,andH.Akahane.1992.“CapacityofSagsandTunnelsonJapaneseMotorways.”ITEJournalVol. 62,No. 5:17–22.
6) Oguchi,T.2008.“RedesignofTransportSystemsonHighways,StreetsandAvenues.”IATSSResearchVol.32,No.1:6–13.
7) TransportationResearch Board. 2003. Access ManagementManual.
8) OguchiT.,H.AkahaneandY.Yamada.2004.“AnalysisofAccidentRateinCriticalConditionofTrafficFlowonExpressways.”TrafficEngineering Vol.39, No.3: 41-46. (inJapanese)
9) OguchiT.andM.Katakura.2000.“NewConceptualEvaluationMethodofAmountofExhaustEmissionGasonVehicular Road Traffic.” Advances in Transport (Urban Transport VI) Vol.6:383-392.
10) http://media2.c-nexco.co.jp/images/press_conference/78/2918114934ea7888494e01.pdf
11) Kanazawa,F.,K.Suzuki,K.Sakai,andK.Iwatate.2013.“ConductingtheFOTtoEvaluatetheDrivingPracticeforSmooth TraffictoMitigateTrafficCongestionatSagSectionsonExpressways.”InProceedingsof20thWorldCongressonITS.CD-ROM.
12) Mehran,B.,M.Kuwahara,andF.Naznin.2012.“ImplementingKinematicWaveTheorytoReconstructVehicleTrajectories fromFixedandProbeSensorData.”TransportationResearchPartCVol.20:144–163.
13) Hanabusa,H.,M.Kobayashi,K.Koide,R.Horiguchi,andT.Oguchi.2013.“DevelopmentoftheNowcastTrafficSimulation SystemforRoadTrafficinUrbanArea.”InProceedingsof20thWorldCongressonITS.CD-ROM.
14) Oguchi,T., M.Ito,R.Mizuta,R.HoriguchiandM.Iijima.2013.“AnalysiswithTrafficSimulationandEvaluationofTraffic CongestionMitigationMeasuresfortheTokyo23-wardsataGreatEarthquakeDisaster.”ProceedingsofTrafficEngineering Meeting, Vol. 33: 273-278. (inJapanese)
RecommendedReading
1) May, A. D.1990. Traffic Flow Fundamentals. PrenticeHall.
2) Daganzo,C.F.1997.FundamentalsofTransportationandTrafficOperations.ElsevierScience.
Practical application projectsfor reference
Practicaloptimalsignalcontrolemphasizingpedestrianroadcrossingrealities:144–147 Significantreductionofcyclelengthviaatwo-stagecrossingsystem:148–151
A study on thepractical deployment and promotion of safe and ecological roundabouts: 152–155
A study on the role andlimitations of motorcycles as a means of urban transport in Southeast Asia:156–159
|
Chapter 4 Traffic engineering Takashi Oguchi Professor, Institute of Industrial Science, The University of Tokyo |
Trafficengineeringgotitsstartwiththepopularizationofinternalcombustionvehiclesintheearly20th century,andhasdevelopedalongwiththeprogressofglobalmotorizationthatbeganafterWorldWar
II.Trafficengineeringtraditionallyencompassesscientificandtechnicalfieldsrelatedtoreductionofthenegativeaspectsofautomobiles,suchastrafficcongestion,trafficsafety,andpollution(environmental load).Thischapterintroducestrafficflowsciencesandprovidesanoverviewofrelatedtechnologies.
4.1Traffic flow fundamentals
Thethreevariables,namely,trafficvolume,density,andspeed,arefundamentaltounderstandautomobile traffic flow onroads.
Thetermtrafficflowrate[vehiclesperhour(veh/h)]—orthetermtrafficvolumeingeneral— describesthenumberofvehiclespassingthroughagivenlocationperunittimebasedonthemeasurementconductedoveradurationof1horpossiblyless.Trafficflowissimplythenumberofautomobilespassingthroughagivenpoint,andthusisthetrafficdemandatthelocationwhenthereisnotrafficcongestion.Ontheotherhand,ifthereistrafficcongestion,thetrafficvolumeisequaltothetrafficcapacity ofthedownstreambottleneck(seeSection4.2)thatcausesthetrafficcongestion.
Thetermtrafficdensity[veh/km]describesthenumberofvehiclespresentatagiventimeperunitspacelengthbasedonmeasurementconductedoveranintervalof1kmorpossiblyshorter.Unliketrafficvolume,directmeasurementoftrafficdensityrequiressimultaneousaerialobservationoverrelatively longstretchesofroadandisnotveryeasy.
Trafficspeed[km/h]istherepresentativespeedofatrafficflowcomprisingvariousvehiclestravelingatdifferentspeeds.Thisrepresentativevaluemustbethespacemeanspeedofindividualvehicles.It iscalculatedbydividingagivenspacelengthbythemeanoftraveltimesrequiredforindividualvehicles totravelthelength.Thespacemeanspeedcanbeestimatedbytheharmonicmeanofthespeedofeach vehicleobservedatagivenlocation.Usingthespacemeanspeedasthetrafficspeed,Eq.(1)holds.
(TrafficvolumeQ)=(TrafficdensityK)×(TrafficspeedV) (1)
| Throughput N1 |
Space V[km/h] V[km/h]
![]() 120
120
100
80
x 60
40
![]() 20
20
0
0 20
| K |
40 60 80100
120
100
80
60
40
20
0
![]()
0 500 1000 1500 20002500
Q[veh/h]
![]() 2500
2500
2000
1500
1000
[veh/km]
Q[veh/h]
500
t Time
0
| K |
0 20 40 60 80 100 120
[veh/km]
Figure1.Time–spacediagram Figure2.Examplemeasurementoftherelation betweentrafficvolume,density,andspeed
Thisequationdoesnotgenerallyholdwhenthesimplearithmeticmeanisusedastherepresentative speedoftrafficflow.Indeed,Eq.(1)correspondstothelawofconservationofmassinbasicphysics, whichisuniversallyholdsforgeneralflowphenomena,notonlytrafficflows.
Figure1showstime–spacetrajectoriesofindividualvehiclesaswellastherelationbetweentraffic volumeanddensity.Asthefigureshows,thesetwovariablesareinasymmetricrelationonthetimeand spaceaxes,withthereciprocalofthemeantimeheadwaycorrespondingtothetrafficvolume,andthe reciprocalofthemeanspaceheadwaycorrespondingtothetrafficdensity.
Figure2showsthemutualrelationsamongthethreevariables,usingactualvehicledetectormeasurementsaggregatedinevery5minandthecalculatedtrafficdensityobtainedbyEq.(1)usingthe measuredtrafficvolumeandspeed.Ingeneral,thespeedapproachesamaximumvalue(thefreespeed) astrafficdensityapproacheszero,andtrafficdensityapproachesamaximumvalue(thesaturationdensity)asspeedapproacheszero.Thesetwovariablesareinamonotonicallydecreasingrelation.Furthermore,thereexistsamaximumtrafficvolumereachedatacertainvalueoftrafficdensity(thecriticaldensity)andacertainvalueofspeed(thecriticalspeed).Densitiesabovethecriticaldensityandspeeds belowthecriticalspeedindicateastateoftrafficcongestion;conversely,densitiesbelowthecriticaldensityandspeedsabovethecriticalspeedindicateanuncongestedtrafficstate.
UsingthemonotonicdecreasingrelationshipbetweendensityandspeedcombinedwithEq.(1),itisstraightforwardtoshowthatthetrafficvolume–density(volume–speed)relationshipisabinaryfunctionthathasamaximumvalueoftrafficvolume.Thisisthetheoreticbasisfortheexistenceofamaximum traffic volume (capacity) for roadtraffic.
4.2Features of traffic congestion
4.2.1 Bottlenecksandthedefinitionoftrafficcongestion
Traffic congestion isdefined as a traffic state (a waitingqueue) in which queued traffic (congestedvehicles)
developsupstreamfromatrafficcapacitybottleneckthatoccurswhentrafficdemandexceedingthebottlenecktrafficcapacityattemptstoenterthebottleneck.Abottleneckisaroadsectioninwhichtraffic capacityisrelativelylowincomparisonwithupstreamanddownstreamroadsegments.Trafficcongestiononinter-cityexpresswaysinJapanisgenerallytriggeredatsagsections(roadsectionswithlongitudinalslopechangesfromdownwardtoupward)orattunnelentrances.1)Ontheotherhand,majorbottlenecksonEuropeanorAmericanexpresswaysaremergingordivergingsectionsandweavingsections. Majorbottlenecksonsurfacestreetsarekeysignalizedintersectionswithheavytraffic,queuesforming atparkinggaragesoflargeshoppingcenters,andon-streetparkedcars.Fromthedefinitionoftraffic congestion,itisobviousthatthereisnofixedspeedthresholdtodistinguishcongestedtrafficconditions fromuncongestedtrafficconditions.Forsimplicity,40km/honinter-cityexpresswaysand20km/honurbanexpresswaysareusedasthethresholdstoidentifytrafficcongestionforpracticaluseinJapan.
4.2.2 Calculating trafficcongestion
Figure3showsasimplifiedassumptionofthevolume–densityrelationshipperlanebasedonthedatashowninFig.2.Figure4schematicallyshowsthechangeintrafficcongestioncausedbyabottleneckon atime–spacediagram.Pointa(trafficvolumeA,trafficdensityk1,velocityv)inFig.3representsthe trafficconditionsoftrafficdemandAattemptingtopassthroughabottleneckwithcapacityCb(location BNinFig.4).Here,inthecasewhereA>Cb,trafficcongestionoccursupstreamofthebottleneck(point binFig.3;trafficvolumeCb,trafficdensityk2,velocityvb),andthetailofthecongestionqueuemoves upstream.TheshockwavespeeduabisgivenbythefollowingEq.(2)accordingtoshockwavetheory:2)
uab=(A−Cb)/(k1−k2) (2)
TheshockwavespeeduabistheslopeofthelineconnectingaandbinFig.3.TheslopeinFig.3isobviouslynegative,whichindicatesthattheshockwavemovesupstream.Theboundarybetween demandtrafficconditionaandtrafficcongestionbmovesatspeeduabinFig.4.Ifthetrafficdemand changestopointcinFig.3(trafficvolumeA',trafficdensityk3,velocityv)andA'<CbholdsattimeT1,thenucbispositive,meaningthatthetailofthecongestionqueueshortensuntilitvanishesattimeT2.
For example, when traffic demand A=1800 veh/h arrives at a bottleneckwith capacity Cb=1600
| [veh/h] |
Q 2000
A C
Space
| v |
BN
b
A'
k2' 25 k2
125 K 0 T1
T2 Time
Figure3.Amodeloftrafficvolume–densityrelation Figure4.Expansionandreductionshockwaveoftrafficcongestion
veh/h,thetailoftrafficcongestionmovesupstreamataspeedofuab=(1800−1600)/(22.5−50)≈–7 km/h,soifT1=2h,thetrafficcongestionlengthL≈14km.IfthetrafficdemanddecreasestoA'=1500 veh/hattimeT1,thenucb=(1500−1600)/(18.75−50)=3.2km/handtimeT2isT1+L/ucb≈6.5h.
Itisgenerallyknownthattheexcessoftrafficdemandoverthebottleneckcapacityisatmost approximately12–15%(inthecaseofthisexample,itis12.5%,asgivenby1800/1600=1.125)even whentrafficcongestionoccursduetoanincreaseintrafficdemand.Itisalsoknownthatthedurationof trafficcongestion(6.5hinthiscase)greatlyexceedsthedurationoftrafficdemandexceedingthecapacity (2h).3)
4.2.3 Featuresoftrafficcongestiononordinaryexpresswaysections
Itwasrecentlyfoundthatoninter-cityexpresswaysinJapan,bottlenecksatsagandtunnelentrancesectionstogetheraccountfor80%ofallbottlenecksections.4)Thereisnomergingortrafficsignalsatsuch sections,butslightspeedperturbationsduetoslightchangesinslopecausespeedreductionshockwaves thatpropagateupstream,causingtrafficcongestion.Theleveloftrafficdemandcausingsuchphenomenavarieswidelyintherangeof75–90%ofthenormalcapacityforordinaryexpresswaysections.This variationisthoughttobeduetothedifferencesbetweenindividualdriversandbetweenvehicletypesin car-followingbehavior.5)
Furthermore,oncetrafficbecomestotrafficcongestion,thebottleneckcapacitydeclinesfurther,to around60%ofthenormalcapacityforordinaryexpresswaysections.Thisisbecausedrivers’carfollowingbehaviorbecomessluggishduetodriverboredomandfatiguecausedbythelowspeedintrafficcongestion.5)Assumetrafficdemandis1800veh/hperlaneasshowninFig.3,andthereducedbottleneckcapacityis1600veh/hperlane,whichisequivalentto80%ofanordinaryexpresswaysection’s normalcapacityof2000veh/hperlane.Thespeedofextensionofthetrafficcongestiontailiscalculated tobeapproximately7km/h(seeSection4.2.2).Ifthereducedtrafficcapacityafterformationoftrafficcongestionis1200veh/hperlane,whichisequivalentto60%ofthenormalcapacityofanordinaryexpresswaysection,thespeedofextensionofthetrafficcongestiontaildoubles,toapproximately14 km/hbasedonFig.3andEq.(2).Atasagsection,thetrafficcapacityisfurtherloweredafterformation oftrafficcongestion,andcausesarapidincreaseinthelengthofthetrafficcongestionqueue.Furthermore,evenwhenthetrafficdemandisreduced,thedurationoftrafficcongestionisprolongedbecause thetrafficcongestionqueueshortensatalowerspeed.Thesearethereasonswhycongestiononexpresswayseasily grows andpersists.
4.3Traffic performance-oriented planning and design of road networks
Expresswaysarethemainarteriesforhigh-volume,high-speedautomobiletransportation.Theyinclude long-distance nationwide expressways that form the backbone ofthe national transportation network, expresswaysthatconstitutemajornetworkswithinregionalareas,andurbanexpresswayswithinlarge cities. For surface roads accepting more variety of transportation modes including pedestriansand
cyclists,therearedifferentfunctionalclassificationsaccordingtoconnectivityscale.Roadsincitiesfurthermoreperformvariousnon-transportationfunctions,suchasprovidingspaceforinfrastructurelike sewageandgaslinesandperformingdisasterpreventionfunctionstopreventthespreadoffire.This makessuchroadswithincities(streetsandavenues)quitedifferentfrominter-cityroads(expresswaysandhighways).InrecentresearchactivitiesinJapan,focushasbeenplacedonsuchdifferenceintransportationfunctionsinhierarchicalroadclassificationstheconceptof“performance-oriented”roadplanninganddesignhasbeenpromotedwiththegoalofattainingaroadnetworkthatprovidesacertain level of traffic servicefunctionality.6)
Phase1 Phase2 Phase3 Phase4
|
|
|
|
![]() Phase1 Phase2 Phase3 Phase4
Phase1 Phase2 Phase3 Phase4
Figure 5. Example of traffic controlimprovement at a key signalized intersection
Junctions, the crossing points of roads, are key locations for transportation and are oneof the most important elements for ensuring hierarchical road functionality. Manytrafficcapacitybottlenecksare atjunctions,especiallyatkeysignalizedat-gradeintersectionsofsurface streets.Atintersectionswheretraffic demandis concentrated, there are needsforpropergeometricdesign (asufficientnumberoflanes,grade separation,trafficislands,etc.)and fortraffic signal phasing planand
optimization of signal control parameters(cycle, green split, and offset) to prevent the occurrence of
traffic congestion(Fig. 5).
Therearemanyintersectionswherethecapacity(Cb)ishighenoughsothattheyarefreefromtrafficcongestionandcapacitybottleneck.EvenwhenthetrafficdemandDisextremelylow(0toD≪Cb), waitingtime (delay) occurs at signalized intersections corresponding to the signalcontrol parameters. Ontheotherhand,whentrafficdemandexceedsacertainvolume(D>Q0)atanunsignalizedintersection, the delay underunsignalized control may exceed that under signalized control. Forintersections withmoderatedemand(0≪DtoQ0<Cb),roundaboutshaveattractedattentioninrecentyearsinJapanasamethodforbothreducingdelayandgreatlyreducingtheriskofrear-endcollisionsanddeai-gashiracollisions(collisionsthatoccurwhenvehicles,bicycles,pedestrians,etc.suddenlyenterintoanintersection)frequently observed at unsignalizedintersections. There has been increasingmomentum for the introduction of roundabouts inJapan.
Toensureacertainleveloftransportationfunctionalityforarterialroads,itisimportantthattrafficflowonarterialroadsnotbeinhibitedmuchatminorintersections.Effectivemeanstothatendinclude techniquesconcerningroadgeometricdesignandtrafficoperationandcontrol,suchasnotconnecting minorstreetstoarterialroads,limitingtheallowanceoftrafficentering/exitingarterialroadsbyleft turnsonly,andprovidingadedicatedauxiliaryrightturnlane(orpocket)atthemedianofarterialroads
toseparatethisexitingrightturntrafficfromthemaintrafficstreamontheroad.Theconceptsdescribed abovearecalled“accessmanagement”intheUnitedStates7) whichaimstoestablishasystematic scheme.
4.4Road traffic management-basedcountermeasures
4.4.1 Fundamentalideas
Thebasicconceptsofcountermeasuresfortrafficcongestionreductionoreliminationareadjustingtrafficdemandandincreasingbottleneckcapacity.Theformerincludeswell-knowntrafficdemandmanagement(TDM),aswellasadditionaleffortstowardmoredynamicadjustmentmethodsinrecentyears suchasprovidingtrafficinformationandrouteguidance.Thelattermainlyincludesphysicalmeasures suchasincreasingthenumberoflanesandexpandingroadnetworks,andadditionallyentailstheintroductionofactivetrafficmanagement(ATM),whichhasbeenpopularinEuropeinrecentyears(seeSection4.4.2).
Improvingtrafficsafetyrequiresamoremultifacetedapproachthatincludesnotonlytrafficengineering,butalsovehicletechnologiesandtheelucidationofhumanfactors.Trafficcongestion,particularlyonexpressways,isasignificantcauseofrear-endandnearcollisionsofvehicles,andtherefore,trafficcongestionalleviationmeasuresmayalsosignificantlyreducesuchaccidents.8)Itisimportanttolet driversnaturallyunderstandtheroadgeometricstructureandconditionsbyapplyingproperroadalignment,arrangementplanningofintersections,andsoforth.Appropriatesettingofoveralltrafficrestrictions,includingsignalcontrolplanning,mayalsoresultinhighlysafespacesforexpressways,aswellas forsurfacestreetswhicharesharedwithpedestriansandcyclists.
Environmental impacts due to roadvehicular traffic include noise, air pollution, and greenhouse gas emissions.Improvements in automobile performance andfuel quality have resulted insignificant lesseningofnoiseandairpollutionproblemsinJapaninrecentyears,andimprovedfueleconomyhas reduced carbon dioxide emissions. Nonetheless,traffic congestion and repeated stopping and starting causedbytrafficsignalswouldleadtoneedlesscarbondioxideemissions,9) andthereforeanytraffic smoothingpoliciestoalleviatetrafficcongestionortoreducenumberofstopsareeffectiveatreducingtheenvironmentalimpactofroadvehiculartraffic.
4.4.2 Expressway trafficmeasures
Expresswaysaremotorways(dedicatedroadsforautomobiles)thatserveasthemainarteriesforhighvolume,high-speednationwideandurbantransportation.Frequenttrafficcongestiononexpresswaysis afunctionalfailureofthesearteries,andleadstomajorlossestothecountryandtoregionalcommunities.Reducingcongestion,especiallyonexpressways,isthusextremelyimportant.Rampmetering,whichcontrolstrafficvolumeaton-ramps,hasbecomeacommonmeasure,andATMsuchaslanebasedvariablespeedlimits(Fig.6)andtemporaryhardshoulderopeninghasalsobeenpopularin developedcountries exceptJapan.
Particularlyseveretrafficcongestionwasexpected tobecausedbypartialopeningoftheShizuokasegmentoftheNewTomeiExpresswayduetotrafficconcentration on the TomeiExpressway section between the Otowa-Gamagori Interchange and Toyota Junction priortoopeningtheAichisegment.Therefore,apolicy wasimplemented that increased the number oftraffic lanesontheTomeiExpresswaybynarrowingthemas showninFig.7,whilekeepingroadwidthunchanged.10) ThismeasureinJapanresultedinagreatreductionof trafficcongestionandtrafficaccidentsontheTomei
![]()
Figure 6. Example of lane-based variablespeed limits (U.K.)
Expresswaysection.Anadvancedautomotivetechnologythathasrecentlybeenattractingattentionisadaptive cruise control (an advanced form of cruise control, whichautomatically maintains a constant speed).Adaptivecruisecontroladjuststhevehicle’sspeedandspacingaheadtoconformtotheleading vehicle’sbehavior.Becausedrivers’car-followingbehaviorisaprimecauseofbottlenecksonordinaryexpressway sections (see Section 4.2.3),adaptive cruise control technology is expected to help reduce trafficcongestion.11)
![]()
![]()
Figure7.IncreasetothreelanesbetweentheOtowa-GamagoriInterchangeandtheToyotaJunctionontheTomei Expressway(source:NEXCOCentralNipponExpresswayCo.,Ltd.pressrelease)
4.5Future trends in traffic management
Oneissueintrafficengineeringistheextremedifficultyofrunninglaboratoryexperiments.Thismakescarefulpracticalobservationsandinvestigationsinthefieldimportant.Smalldifferencesandchangesin trafficflow,suchas10–20%variationsintrafficdemandandtheemergenceoftrafficcongestionatsag sectionsduetoindividualdifferencesindriverbehavior,canhaveasignificantimpactonthecharacteristicsoftrafficflow:whetheritiscongestedoruncongested.Theconventionalpointobservationswith vehicledetectorsdescribedinSection4.1havelimitationstodescribesuchtemporalandspatialvariations.
Advanced information technology has enabledthe establishment of “probe” technology that allows
temporally and spatiallycontinuous measurement and monitoring of traffic status via automobilemountednavigationsystemsordrivers’smartphones.Completeknowledgeoftheoverallquantitative featuresoftrafficflow,however,remainsdifficultbecausesuchtechniquesprovideonlysampleddata.
![]() Anestimationmethodoftheoveralltrafficstateincombinationwithdatafromvehicledetectors andprobedatahasrecentlybeendevelopedbyapplyingthetrafficflowtheorydescribedinSection 4.2.12)Itisexpectedthattheaccumulationoflargeamountsofdetectorandprobedataandtheapplicationofrecentdataminingtechnologieswillprovidedramaticincreasesinourknowledgeofoveralltrafficstates.Basedonknowledgederivedfromsuchaccumulateddata,real-timeuseofsensorandprobedatawillallowtheestablishmentof“nowcast”technology13)toestimatethecurrenttrafficstatethrough theapplicationoftheory-basedtrafficsimulationmodels.Thedynamicflexibleapplicationofnowcast technologyapplied to traffic information provision,route guidance systems, and ramp metering and TDMmeasuresshouldresultinminimizationofdailyrecurrenttrafficcongestion.Thenowcasttechnologyisalsoconsideredtoallowforpromptplanningandexecutionofcountermeasuresagainstbad weather,largeevents,trafficaccidents,andotherincidentsthataredifficulttopredict.
Anestimationmethodoftheoveralltrafficstateincombinationwithdatafromvehicledetectors andprobedatahasrecentlybeendevelopedbyapplyingthetrafficflowtheorydescribedinSection 4.2.12)Itisexpectedthattheaccumulationoflargeamountsofdetectorandprobedataandtheapplicationofrecentdataminingtechnologieswillprovidedramaticincreasesinourknowledgeofoveralltrafficstates.Basedonknowledgederivedfromsuchaccumulateddata,real-timeuseofsensorandprobedatawillallowtheestablishmentof“nowcast”technology13)toestimatethecurrenttrafficstatethrough theapplicationoftheory-basedtrafficsimulationmodels.Thedynamicflexibleapplicationofnowcast technologyapplied to traffic information provision,route guidance systems, and ramp metering and TDMmeasuresshouldresultinminimizationofdailyrecurrenttrafficcongestion.Thenowcasttechnologyisalsoconsideredtoallowforpromptplanningandexecutionofcountermeasuresagainstbad weather,largeevents,trafficaccidents,andotherincidentsthataredifficulttopredict.
Forexample,Fig.8showsthestateofextraordinarilymassivetrafficcongestionthatoccurredon majorarterialroadsintheTokyoMetropolitanArea immediatelyafter the Great East Japan Earthquake onMarch11,2011.14)Gridlock,whichisthephenomenonwhereanentireroadtrafficnetworkbecomesparalyzed,emergedonthatday.Gridlockcanbe definedasthetrafficstatewherethethroughputofabottleneckisreducedtoavaluelowerthantheoriginalbottleneckcapacitybythetailofatrafficconges-
tion formed upstream of thebottleneck extendingto
thebottlenecklocationonaloop-shapedroadnet-
Figure 8. Gridlock of arterial roads in Tokyo
work.Gridlockisaserioustrafficcongestionphenomenonthatisextremelydifficulttoresolveonceit starts.Itisbelievedthatthedevelopmentofasystemforreal-timedetectionofgridlock,ortheestablishmentoftrafficcontrolmethodsforpredictingandavoidingit,wouldbeasignificantcontribution leadingtoincreasedstabilityandreliabilityofroadtransportationsystems.
References
1) Koshi,M.1985.“TrafficFlowPhenomenainExpresswayTunnels.”IATSSResearchVol.9:50–56.
2) Lighthill,M.J.,G.B.Whitham.1955.“OnKinematicWaves:2.ATheoryofTrafficFlowonLongCrowdedRoads.”ProceedingsoftheRoyalSocietyofLondonAVol.229:317–345.
3) Koshi,M.,H.Akahane,andM.Kuwahara.1989.“ExplanationofandCountermeasuresagainstTrafficCongestion.”IATSS Research Vol.13, No. 2:53–63.
4) http://www.mlit.go.jp/road/ir/ir-council/autopilot/pdf/05/6.pdf.
5) Koshi,M.,M.Kuwahara,andH.Akahane.1992.“CapacityofSagsandTunnelsonJapaneseMotorways.”ITEJournalVol. 62,No. 5:17–22.
6) Oguchi,T.2008.“RedesignofTransportSystemsonHighways,StreetsandAvenues.”IATSSResearchVol.32,No.1:6–13.
7) TransportationResearch Board. 2003. Access ManagementManual.
8) OguchiT.,H.AkahaneandY.Yamada.2004.“AnalysisofAccidentRateinCriticalConditionofTrafficFlowonExpressways.”TrafficEngineering Vol.39, No.3: 41-46. (inJapanese)
9) OguchiT.andM.Katakura.2000.“NewConceptualEvaluationMethodofAmountofExhaustEmissionGasonVehicular Road Traffic.” Advances in Transport (Urban Transport VI) Vol.6:383-392.
10) http://media2.c-nexco.co.jp/images/press_conference/78/2918114934ea7888494e01.pdf
11) Kanazawa,F.,K.Suzuki,K.Sakai,andK.Iwatate.2013.“ConductingtheFOTtoEvaluatetheDrivingPracticeforSmooth TraffictoMitigateTrafficCongestionatSagSectionsonExpressways.”InProceedingsof20thWorldCongressonITS.CD-ROM.
12) Mehran,B.,M.Kuwahara,andF.Naznin.2012.“ImplementingKinematicWaveTheorytoReconstructVehicleTrajectories fromFixedandProbeSensorData.”TransportationResearchPartCVol.20:144–163.
13) Hanabusa,H.,M.Kobayashi,K.Koide,R.Horiguchi,andT.Oguchi.2013.“DevelopmentoftheNowcastTrafficSimulation SystemforRoadTrafficinUrbanArea.”InProceedingsof20thWorldCongressonITS.CD-ROM.
14) Oguchi,T., M.Ito,R.Mizuta,R.HoriguchiandM.Iijima.2013.“AnalysiswithTrafficSimulationandEvaluationofTraffic CongestionMitigationMeasuresfortheTokyo23-wardsataGreatEarthquakeDisaster.”ProceedingsofTrafficEngineering Meeting, Vol. 33: 273-278. (inJapanese)
RecommendedReading
1) May, A. D.1990. Traffic Flow Fundamentals. PrenticeHall.
2) Daganzo,C.F.1997.FundamentalsofTransportationandTrafficOperations.ElsevierScience.
Practical application projectsfor reference
Practicaloptimalsignalcontrolemphasizingpedestrianroadcrossingrealities:144–147 Significantreductionofcyclelengthviaatwo-stagecrossingsystem:148–151
A study on thepractical deployment and promotion of safe and ecological roundabouts: 152–155
A study on the role andlimitations of motorcycles as a means of urban transport in Southeast Asia:156–159

