
Chapter 8 Procument and Supply Chain Management
8.5 Supply Chain Management Methods
The operational efficiency is crucial when trying to stay ahead of the competition in the business world. Although larger enterprises remain poised to reap the benefits from optimized Supply Chain Management(SCM), these advantages are also available for enterprises of all sizes, including small businesses.
One of the most significant innovations in supply chain management is the adoption of cloud-based technology. It dovetails nicely into the mobile device revolution, because enterprises now apply smartphones and tablet computers for real-time access to data about their supply chain.
8.5.1 Quick Response (QR)
QR is a management concept which is created to increase customer satisfaction and survive increasing competition from new competitorsa. The goal of QR is to shorten the lead time from receiving an order to the delivery of goods and increase the cash flow.
The QR system, a production and distribution system for quick response to the market, was designed for the U.S. textile industry to compete with other low-cost enterprises in the global market. VICS(Voluntary Interindustry Commerce Standards Association)is the organization that strongly promotes QR. The Electronic Data Interchange(EDI)protocol used for the QR system, is a standard protocol for information exchange between the U.S. retail industry and enterprises. It is also called“ VICS”, a subset of ANSIX. Although“ VICS” is the name of the organization that promotes QR, it is also the name of EDI, i.e., the exchange of data(all data such as order placement and billing data)between enterprises who support QR.
QR was created from a project to improve the performance of supply chain management in industries such as the textile industry. The concept of ECR(Efficient Consumer Response)on the other hand was created by the processed food distribution industry. Both concepts were created from the standpoint of increasing customer satisfaction as a means to survive against some types of competitors that producer-retailer alliances call discounters and category killers. These concepts are trying to reduce lead time from order receipt to delivery, shrink unsold inventory by keeping mini-mum level of inventory and increase cash flow.The advantages of QR are primarily to reduce costs and provide better service. It is not only faster but less expensive as well. Besides improving the speed of processes, QR also leads to reduction in waste and cost savings. It eliminates the need for overproduction and results in manufacturing as per need of the customer.
Quick Response Logistics(QRL)is another name for Just-In-Time(JIT)systems or EDI. No matter the term used, QRL means reducing the order cycle. Many large-scale retail stores like Target and Wal-Mart have applied QRL, as have many textile companies. In QRL, when products are ordered, the bar codes will be scanned, recording the inventory reductions.
Purchase orders are automatically generated and electronically fed into the supplier’s information system from the retail stores. The supplier then picks the order for items to refill stock requirements in terms of quantity, size, color, and other attributes and has them shipped to the retailer immediately. Enterprises adopt QRL in consideration of reduced order entry errors, paper-work, order cycle time, retail inventory levels, warehousing needs, and increased inventory turnover. All of these can cut down costs and increase profits. The period of the order cycle directly affects the inventory an enterprise must carry, thus the implementation of a QRL system can positively affect inventory management.
To obtain these benefits, partnerships and alliances must be established based on trust and mutual dependency. In an alliance, the partners operate in line with each other’s needs. That is to say, the alliance becomes a horizontal pipeline where goods flow seamlessly from one enterprise to another. It is noted that some powerful retailers may invert the pipeline, which may cause trust and mutual dependency to yield to fear and power. The retailers simply require that processes are operated in a certain manner and that the suppliers follow the retailers’ requirements. If not, the retailers will turn to other suppliers. Figure 8.5 illustrates
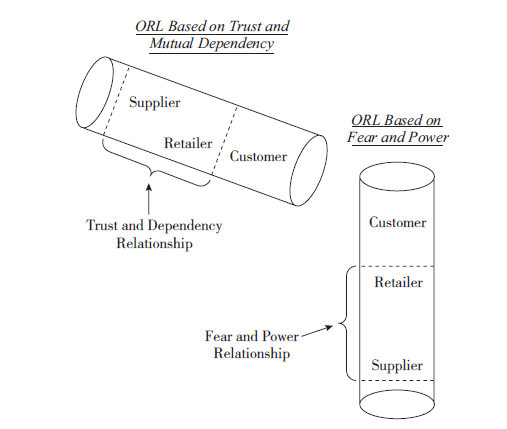
Figure 8.5 Different approaches to quick response logistics
In a QRL system that is built on trust and mutual dependency, suppliers and retailers can form long-term relationships. The relationships are based on the idea that what affects one entity will affect the other. A QRL established on fear and power overturns the idea that whatever the retailer demands, suppliers must follow, otherwise they will lose business. Both relationships work, that is, the stocks are replenished quickly and the customers order what they need. However, the relation-ship based on fear and power will erode over time since new suppliers will be added as existing ones are knocked out.
8.5.2 Efficient Consumer Response (ECR)
ECR is a strategic concept created by the famous consulting company “Kurt Simon Associates” at the request of enterprises concerning the processed food distribution industry in the U.S., aiming to recover the competitive strength for surviving in the turbulent time of the industry when discoun-ters emerged in the United States. Whether a company can survive depends on whether the company can provide customers with higher values.
ECR is a strategy to increase the level of customer services by close cooperation among retailers, wholesalers, and manufacturers. By aiming to increase the efficiency of a supply chain as a whole beyond the rampart of retailers, wholesalers, and manufacturers, they can consequently obtain more profits than each of them pursuing their own business goals. Enterprises that compose the links of the supply chain can reduce the opportunity loss, inventory level, and entire cost, as well as increase profitability by sharing the purpose of “customer satisfaction”.
With regard to ECR, reengineering such as eliminating or adding business operations is conduct-ed by checking all business operations of the supply chain by a criterion of whether they contribute higher values to customers. It aims to provide better convenience, better products, better quality, and better selection and establish a “Win-Win” relationship among different entities (i.e., every company in the supply chain wins and obtains higher profits). The first target of ECR is to reengineer business processes. To accomplish the reengineering, information technology such as EDI that is used for precise and timely exchange of information between enterprises is necessary. The characteristics of ECR is that reengineering is executed considering ultimate results given to customers from unifiedbusiness processes and that can be realized by information technology. The process of ECR is illustrated in Figure 8.6.
The goal of ECR is to improve product flow by minimizing inventory of a supply chain and make the goods flow faster. Specific practices of ECR include:
• From monthly order placement to weekly order placement, from weekly order placement to daily order placement.
• Small-lot and frequent delivery in order to shorten lead time and reduce inventory.
• Close docking to reduce work of sorting and distributing goods.

Figure 8.6 Process of ECR
It is said that whether a company implemented ECR or not can decide the fate of the company, either growing, changing, or going out of business. The movement of ECR began in the Mid-1990s and was characterized by the emergence of new principles of collaborative management along the supply chain. It was commonly realized that enterprises could serve customers better, faster and at less cost by working together with trading partners.
The core of ECR was a business environment characterized by significant advances in information technology, increasing competition, pressure on margins, global business expansion and customer demand focused on better choice, service, convenience, quality, freshness and safety and the increasing movements of cargoes across international borders.
The new situation required a radical reconsideration of the most effective means of shipping the right goods to customers at the right price. Non-standardized operations and the rigid separation of the conventional roles of manufacturer and retailer, together with the lack of cooperation between them, threatened to block the supply chain unnecessarily and failed to explore the synergies that came from highly efficient new information technologies and planning tools.
To better serve the customers, ECR set out to overturn the conventional model and eliminate non-productive barriers. The impacts were extensive and continue to resonate across the industry. There are four focus areas of ECR as illustrated in Figure 8.7. These areas are broken down further into core and advanced improvement concepts.

Figure 8.7 Four focus areas of ECR
These concepts are commonly known and well documented methods, which can be used to improve effectiveness and efficiency. However, when applied under ECR, they have two distinct differences:
(1)They are intended to be addressed as an integrated set, not individually;
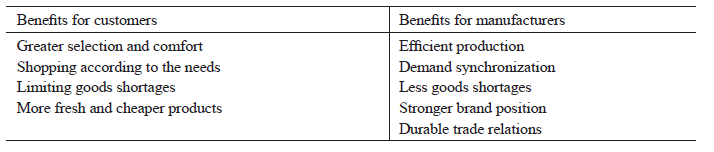
(2)They are assessed in terms of their impact across the whole supply chain, not just the business of individual trading partners. The benefits for the customers and manufacturers are given in Table 8.1.
Table 8.1 Benefits for the customers and manufacturers
8.5.3 Activity Based Classification (ABC)
1. ABC concepts
(1)Inventory valuation method
Activity-based product costing can be used as an alternative to the conventional inventory valuation methods, or as a separate stand alone, microcomputer based system designed only to acquire more precise information for decision-making. If ABC replaces traditional full absorption, or variable costing, it becomes the company’s inventory valuation methoda.
Then, the activity-based costs flow through the perpetual inventory accounts. However, if the ABC method is adopted as a separate management decision support system where activitybased product costs are determined only once a year, then it is not serving as the company’s inventory valuation method.
(2)Resource consumption decision support model
Whether the ABC method is adopted as a replacement for conventional inventory valuation or as a stand-alone method, it offers information about how and why resources are consumed. Therefore, according to ABC advocates, it is not just an inventory valuation method, or only a separate product costing method. The ABC method is a resource consumption model that can provide a great deal of information to facilitate decisions regarding product and process improvements.
(3)Cost accumulation method
Another clarification regarding how the ABC method fits into the overall cost accounting system has to do with cost accumulation. It is known that there are two fundamental cost accumulation methods, job order costing and process costing. The ABC method is not a cost accumulation method, therefore it does not replace these methods, but instead it is adopted to improve the accuracy of the product costs determined in both job cost and process cost environments. In most cases, the ABC method is based on 2 to 4 kinds of products, which seems to imply a process orientation. However, since there are likely to be more product variations or differences in a job costing environment than in a process costing environment, it is logical to assume that the potential benefits of applying the ABC method are greater for enterprises that produce a great number of products to meet customer specifications, than for enterprises that have more focused processes dedicated to a few common products.
2. Problems with conventional systems
Two major problems tend to occur when conventional inventory valuation methods are applied to provide information for management decision purposes. One is related to product cost distortions or cross-subsidies, and the other is associated with the exclusiveness of conventional product costing.
(1)Product cost distortions and cross subsidies
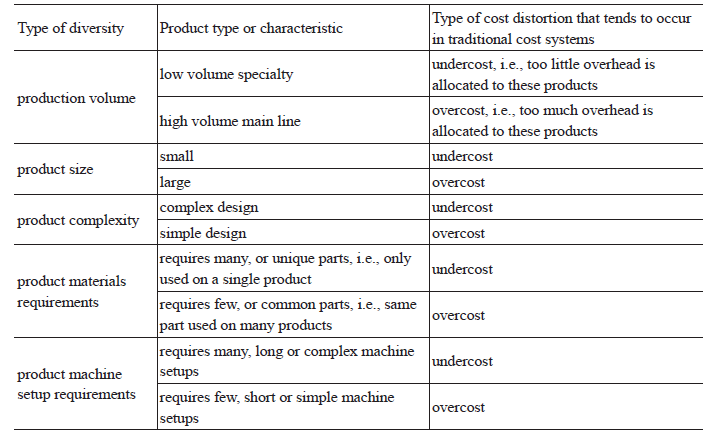
In traditional costing, only production volume related methods are adopted to allocate overhead costs to products, even though many products don’t consume indirect resources(overhead)in proportion to the production volume. Because many indirect resource costs are caused by, or driven by, non-production volume related features such as size and complexity, conventional costing is inclined to distort product costs. Sometimes, too much overhead cost is allocated to some products, while too little overhead cost is allocated to other products. These distortions are usually called cross-subsidies. Summary of cost distortions that tend to occur in traditional cost systems is shown in Table 8.2. In general, the ABC method solves the problem by separating overhead costs into different categories referred to as cost pools. Costs that are caused by, or driven by, the same activity are pooled together and then allocated, or traced, to products using a proper measure of the activity volume.
Table 8.2 Summary of cost distortions that tend to occur in traditional cost systems
(2)Excluding non-manufacturing costs
Another issue with conventional cost systems is that tracing product related administrative, marketing and distribution costs to product inventories is not a generally acceptable procedure allowable for external reportinga. However, engineering design, marketing, distribution and customer service costs are obviously part of the costs of shipping a product to the customer. Because these non-manufacturing costs may differ greatly from product to product and from consumer to consumer, The ABC method traces these costs to products and consumers using additional cost pools and activity measures. Therefore, the ABC method provides the potential of identifying more precise product costs for management decisions in relation to product planning, product design and introduction, product design modifications, product marketing, product distribution, sales service, etc. The ABC method also provides potential benefits to many service oriented industries such as banking, insurance, health care and transportation. To keep the explanations in this chapter fairly simple, we will focus on manufacturing costs, but keep in mind that non-manufacturing costs are also traced to products and services using the ABC method.
3. The logic of ABC
The logic of ABC method is explained as follows. First of all, designing, producing and distributing products or services requires a series of activities to be performed. Performing these activities requires resources to be ordered and used. Ordering and use of resources causes costs to be incurred. Restated in reverse order, the ABC logic is that resources generate costs, activities consume resources and products consume activities. Therefore, the activities of an enterprise are identified, then the costs are traced to these activities(or activity cost pools)according to the resources that they demand. Then, the costs are assigned, or traced from each of these activity cost pools to the enterprise’s products or services in proportion to the demands that each product or service places on each activity. In the ABC method, a measure of the related activity volume is employed to trace each type of costs, rather than exclusively using measurements(or allocation bases)in relation to the volume of the products or services provided. Using this logic, ABC can solve the problems raised by conventional cost or inventory valuation methods. The ABC logic is shown in Figure 8.8.
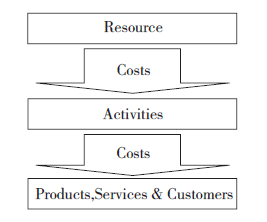
Figure 8.8 Cost assignment based on ABC logic
There are still two stages in allocating costs to products in a manufacturing environment, ① from service departments(activities)to producing departments, and ② from producing department activity cost pools to products.
(1)How activity measures are selected
The designers of ABC method usually use interviews with knowledgeable managers to define activities, cost pools and cost driver relationships. Even though the statistical tools might be useful in aiding this process, there may be some serious constraints that limit their application for this purpose.
First of all, the analysis on short-term data may produce very misleading results, since correlation analysis with short-term data is unable to reveal the drivers of long-term variable costs, i.e., the costs identified as fixed costs in conventional costing. Another key idea in ABC is that cutting down the volume of a specific activity measurement will not necessarily generate a short-term effect on the cost of the activity. The decrease in activity requirements may simply generate idle or excess capacity. Data collected for a longer period(e.g., 2 to 3 years)might be more useful in determining drivers and activity measures for longterm variable costs, but the data would have to be modified to eliminate the impact of nonstationary factors such as changes in production processes, inflation and seasonal variations. These factors can lead to autocorrelation which tends to confuse rather than clarify the relationships involved.
Secondly, the overall correlation between an activity measure and the overall demands placed on the activity by the enterprise’s products may be very high, although the correlation of the activity measure with the demands of some particular products is relatively low. For instance, if 98% of a company’s products demand short machine setups,(e.g., one hour) while the remain 2% require long setups,(e.g., eight hours)then, the overall correlation between the number of setups required and setup costs would probably be very high.
However, allocating the setup costs to products based on the number of setups would tend to undercost the products that require long setups and overcost the products that demand short setups. The key point of this discussion is that precise cost tracing requires high correlation between the activity measure and the demands of each specific product, not just high overall or average correlation.
(2)ABC cost hierarchy
A cost classification scheme, sometimes called ABC cost hierarchy, puts all costs into one of the following categories:
• Unit level. The cost of an activity required once each time a unit of product is produced;
• Batch level. The cost of an activity required each time a batch of products is produced;
• Product level. The cost of an activity required to support a specific type of product;
• Facility level. The cost of an activity associated with maintaining the facility or plant;
• Customer level. The cost of an activity required to support a specific customer.
① Batch and product level activities. If an activity is triggered primarily by the orders, lots, or batches of products produced, then it falls into the batch level category. For instance, if the activities concerning purchasing, receiving and storing materials are initiated by production orders for the production of batches of products, then these are called batch level activities. On the contrary, if these same activities are carried out mainly to keep an average inventory of raw materials available without considering specific batches, then they might be called product level activities.
② Facility and customer level activities. Examples of customer level activities may include accounts receivable, special packing conditions, distribution or shipping requirements and special customer services. Examples of facility level costs may include building maintenance, asset taxes and insuran-ce, plant security and the plant manager’s salary. Most of the facility level costs are common to all products and need not be allocated to products for management decision purposes.
(3)What’s the point of the cost hierarchy?
The ABC cost classification scheme helps emphasize the difference between conventional costing and activity-based costing. In allocating cost to products, conventional costing treats all manufactu-ring costs as unit level costs, thus they are called Production Volume Based (PVB), or unit based allocations. On the other hand, ABC realizes that many support costs in an enterprise are either related to activities associated with producing batches of products, or to other activities that are implemented to support specific products. Additionally, conventional costing deems marketing, distribution and customer service costs as period costs, while ABC traces, or tries to trace, these product level and customer level costs to products and customers.
4. Four steps in designing an ABC system or sub-system Designing an ABC model, system or sub-system requires:
(1)identifying the major activities of an enterprise;
(2)determining the primary and secondary drivers for these activities;
(3)aggregating activities into homogenous cost pools;
(4)choosing activity measures to represent each pool.
Homogeneous activity costs are those ones that are consumed in the same proportions. Under-standing these relationships allows the designer to combine homogenous costs into a single cost pool to simplify the system.
8.5.4 Value Chain Analysis (VCA)
1. Introduction
With ever-increasing competition for unbeatable prices, exceptional products and customer loyalty, enterprises must continually evaluate the value they create. Value is the total amount(i.e. total revenue)that buyers are willing to pay for a product. The difference between the total value and the total cost performing all of the firm’s activities provides the margin. Margin implies that enterprises realize a profit margin that depends on their ability to manage the linkages between all activities in the value chain. In other words, the enterprise is able to deliver a product/service for which the customer is willing to pay more than the sum of the costs of all activities in the value chain. A value chain is a strategy that involves the creation of a systematic set of steps or activities that incrementally add value to the goods or service produced. For companies that produce goods, the value chain starts with the raw material used to make their products, and consists of everything added before the product is sold to consumers.
Value chain analysis is a strategy tool used to analyze the internal activities of an enterprise. Its goal is to recognize which activities are the most valuable to the enterprise and which ones could be improved to provide competitive advantage. In other words, by looking into internal activities, the analysis reveals where a company’s competitive advantages and disadvantages are.
Michael E. Porter in Harvard Business School was the first to introduce the concept of a value chain. He splits a business’s activities into two categories: primary and support. Primary activities include inbound logistics, operations, outbound logistics, marketing and sales, and service. The support activities help the primary functions and comprise procurement, technology development, human resource management, and firm infrastructure. Based on this classification, value chain analysis can be conducted.
2. The process of value chain analysis
To perform value chain analysis, you need to follow the three stepsa:
• Activity analysis: firstly, you should identify the primary and support activities you undertake to deliver your product or service.
• Value analysis: secondly, for each activity, you consider what you would do to generate the greatest value for your customer.
• Evaluation and planning: finally, you evaluate whether it is worth making modifications, and then plan for action.
(1)Activity analysis
The first step is to think about the activities that you, your group or your enterprise undertakes that in some way contribute towards your customer’s experience. At the enterprise level, this will include the step-by-step business processes that you use to serve the customer, including marketing of certain products or services, sales and ordertaking, operational processes, delivery, support, etc.
At a personal or group level, it will involve the step-by-step flow of work that you implement. But other things will also be included. For example:
• How do you recruit personnel with the skills to provide the best service?
• How do you encourage yourself or your group to work better?
• How do you keep in touch with the most current and effective techniques?
• How do you make a selection and develop the technologies that give you the edge?
• How do you obtain feedback from your customer on your performance, and how you can improve it further?
(2)Value analysis
With each activity you’ve identified in the previous step, list the “Value Factors” things that your customer value in the way that each activity is carried out. Let’s see an example. If you’re thinking about a telephone order-taking process, your customer will value a rapid answer to his/her call, a polite tone, efficient taking of order details, quick and knowledgeable answering of concerns, and an efficient and quick resolution to any problems that arise.
If you’re considering delivery of a professional service, your customer will most likely value a sound solution, which should be based on completely up-to-date information, clearly expressed and easily actionable. Write down these Value Factors next to each activity you’ve identified. And then record what needs to be done or modified to provide great value for each Value Factor.
(3)Evaluate the changes and plan for action
Once you’ve completed your value analysis, it is time to take actions. At this moment, you’ll have a lot of ideas for increasing the value you deliver to the customer. If you could do all of these, your service could be fabulous! Be careful at this stage: you may not always focus on this job all the time since you have plenty of jobs to do. Therefore, firstly, you can select the quick, easy, cheap wins — go for some of these, as this will improve your group’s spirits to no end. Then screen the more difficult changes. Some changes may be impractical based on the current conditions. Others will deliver only marginal improvements, but at a higher cost. You have to skip these. And then prioritize the remaining tasks and plan to handle them in an achievable, step-by-step way that delivers steady improvement simultaneously and keeps your group enthusiastic.
3. Example of value chain analysis
Lakshmi, a software development manager is working with her team to think about how they can deliver excellent service to their customers by Value Chain Analysis. In the stage of Activity Analysis, the following activities that create value for customers are identifieda:
• Order taking
• Enhancement specification
• Scheduling
• Software development
• Programmer testing
• Secondary testing
• Delivery
• Support
The manager also identifies the following non-client-facing activities as being important:
• Recruitment: selecting employees who will cooperate well with the team members.
• Training: helping new team members become effective as quickly as possible, and helping them learn about new software, techniques and technologies as they are developed. The manager writes these activities down in a vertical value chain on the whiteboard(Figure 8.9).
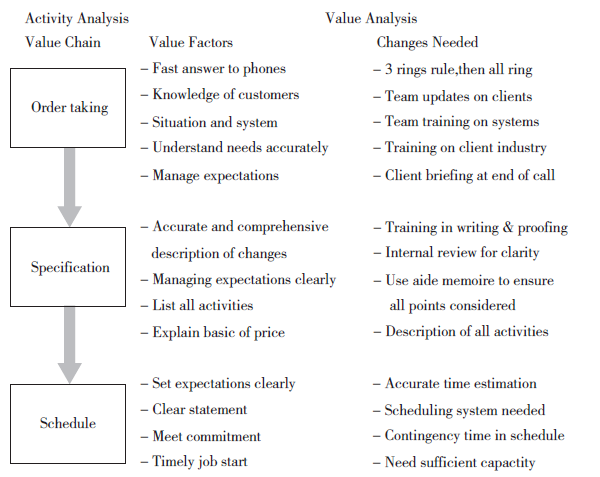
Figure 4.9 Example of value chain analysis
Next, they focus on the Order Taking process, and identify the factors that will value most to customers. The following Value Factors are identified(Figure 8.9):
• Giving a fast answer to incoming phone calls;
• Having a good knowledge of the customer’s business, status and system, so that they do not waste the customer’s valuable time with unnecessary explanation;
• Asking necessary questions, and getting a complete and accurate understanding of the customer’s needs;
• Explaining the development process to the customer and managing his/her expectations as to the likely timetable for delivery.
They then check what they need to do to provide the maximum value to the customer. These tasks are shown in the column of “Changes Needed” in Figure 8.9. They then follow the same procedures for all other processes. Once all brainstorming is complete, the manager and her team may be able to identify quick wins, reject low yield or high cost options, and agree their priorities for execution.

